
It’s important to be intentional with the key performance indictors (KPIs) you choose to use as a measure of success. Quality KPI metrics can help generate useful data that, once analyzed, can drive value and inform strategy for your business.
A well-structured KPI dashboard delivers a story about your business history so you can strategize where it’s going next. Meaningful numbers give managers the information they need to spot trends and adapt to them.
Monitor KPIs
Remember, the K in KPI stands for key. The data analyzed on the instrument panel should be data that drives business conversations. Using KPI dashboards and predictive analytics can help your organization see the bigger picture and determine if changes need to be made in your data analytics strategy.
High Visibility Grows Credibility
To help your organization target KPI metrics that drive the business forward, your data analytics needs to have high visibility and credibility.
High visibility allows everyone to see and analyze the data. Making your content credible requires a regular conversation with managers to talk about the data, what it means, and to identify the story it tells.
KPI Dashboards
KPI dashboards should be able to tell the whole data story. When you put a piece of information on a KPI dashboard, it tends to raise questions. You want to anticipate as many of these questions as possible so you can get in front of any decision making.
When analyzing data on a dashboard, it can take several different charts to see what’s happening with a single KPI. If you study the numbers, there's a lot of information that's going to help you see the trend and identify what the data really means.
Revenue KPI Dashboard Example
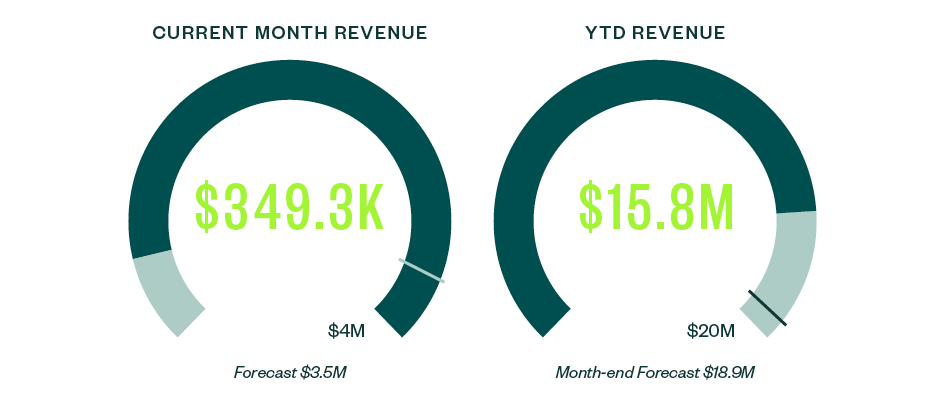
For example, current month revenue and year-to-date (YTD) revenue are shown above. Currently, the organization is at around $350,000 and the target revenue is $4 million. There's a little over $3 million remaining in the current month to get to the target. The YTD is about $4 million short.
These numbers show that you’re on track, but not ahead. You really need this month to go as forecast to stay on track. This is key information that managers and executives will want to be in front of to create and execute a strategy.
Growth KPI Dashboard Example
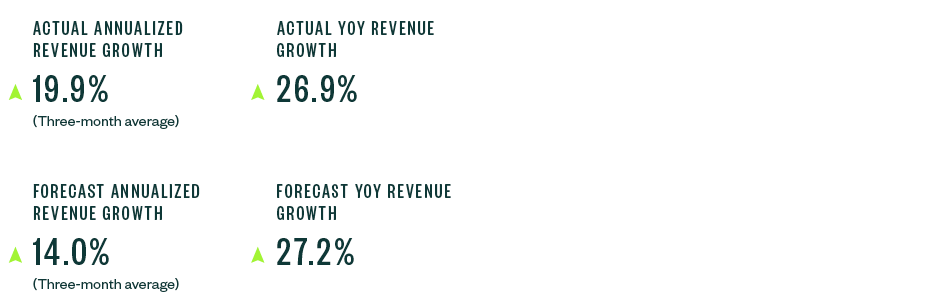
At top right, the data shows 26.9% year-over-year growth. But data from the most recent three month forecast for the year shows growth will be closer to 19.9%. This is still good growth, but the curve is flattening. The forecast is running from predictive analytics, and it’s also forecasting a flattening of the curve.
The data is showing a trend worthy of a management conversation. Tracking the data analytics dashboard will monitor the change.
Predictive Data Analytics
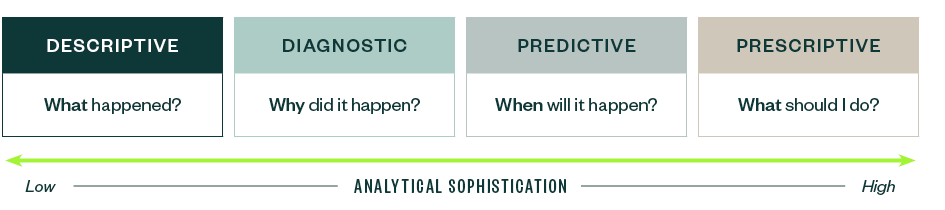
Complete, accurate data for your brick-and-mortar or e-commerce business helps generate more accurate, predictive, and prescriptive data analytics capabilities. This could help you understand when something could happen or, more importantly, what you should do about it.
With a centralized data analytics warehouse, and with emerging advanced artificial intelligence (AI) and machine learning (ML) tools, you can see the pattern behind the data.
Data analytics patterns include:
- Customer behavior changes
- Marketing campaign effects
- Operation optimization options
- Additional business insights
More data gathered can show how well the prediction reflected reality. Data can then be fed back to train the models to understand and adapt the future prediction. Self-fulfilling, iterative processes can be strategic game changers for many brick-and-mortar and e-commerce organizations.
Become a Data-Driven Organization
There are two steps you can take to become a data-driven organization.
Identify Opportunities
Gather input from all stakeholders and identify KPI metrics to deliver the biggest impact throughout the company.
Plan and Execute
Hold everyone accountable and empower employees to utilize KPI dashboards and data analytics that could help drive business.
Base Decisions on KPI Metrics and Grow Slowly
Wherever you aim to be with your data, integrating new data analytics dashboards and processes can be done incrementally.
Based on the KPI metrics that stakeholders identified, begin by implementing processes that can be used to monitor related metrics. This may be moving from a spreadsheet into a forecasting platform, which can be a short-term and inexpensive way to grow.
We’re Here to Help
For help assessing your current data structure and implementing more robust data analytics platforms and processes, contact your Moss Adams professional.
You can also visit our Data Analytics Consulting Services for additional resources.