Accelerate Your Human Capital Strategy with an Organizational Data Model

Organizational data modeling—a way of organizing your human capital and resources information—can unlock your ability to bring to light answers to key operational questions about human capital planning, operational efficiency, and operational effectiveness.

Leaders today are continuously challenged to design their organization in a way that will achieve growth and efficiency at multiple levels, from the company overall down to specific departments.

Organizational data modeling can be a powerful tool to provide leaders access to a curated set of organization data. In turn, this can help them derive better insights from their data and take a more data-driven approach to driving the business’ strategic agenda.

The Importance of Focusing on Human Capital

An argument can be made that an organization’s human capital is its most valuable asset, perhaps even more than financial instruments—no amount of money can help an organization succeed without the right people moving it forward.

Despite this, a common perception of data-driven initiatives is that the investment made by organizations to gain quantitative insights into the state of their human capital often seems relatively small compared to the investments earmarked for designing dashboards, analytics, key performance indicators (KPIs), data stores, and all manner of data-driven tools that manage financial assets.

This is not to say HR functions are underfunded, but it’s a reflection that the application of data-driven methods for managing human capital takes careful thought. Humans, unlike dollars, are more than just numbers that are inherently quantitative.

So, how does one even begin to analyze human capital strategy in an objective, quantitative manner?

How to Approach Organizational Data Modeling

Organizational charts used to visually represent structure—be they hierarchical, matrix, network, or flat—are complicated to build and can often be influenced by an organization’s political subtext.

For example, individuals at different hierarchical levels might appear at the same level on a chart for the sake of optics or reasons rooted in other subjective criteria.

To better analyze your human capital data, here’s a multistep approach that can help you get started.

1. Identify the Available Data to Analyze

While there are many organizations that have made significant human resource information systems (HRIS) or human capital management (HCM) investments in platforms such as Workday, Cornerstone, or PeopleSoft, organizations that haven’t implemented such platforms can, at the very least, be expected to track a roster of employees and their immediate supervisors.

An employee roster is all you need to begin building an organizational data model that can unlock key insights into your organization’s structure.

2. Leverage Existing Roster Data for Pragmatic Decisions

You want to gain unbiased insights and make pragmatic decisions about your organization’s structure.

When you anchor the generation or creation of your organizational charts to an organizational data model, it drives the creation of perspectives that are better shielded from subjective interpretations of titles and political considerations of job levels.

At its core, an organizational data model interprets every supervisor-subordinate relationship in your human capital roster and aligns every individual based on their distance from the topmost decision maker.

This unlocks the ability to easily select any employee and analyze who sits above and below them in your organizational chart. It also lets people compare individuals based solely on their actual level in the organizational structure relative to their position in the chains of command and associated responsibilities.

It can help you look at every member of your organization, create a baseline for their peers according to the data, and assess if factors such as titles and responsibilities are appropriate based on relative leveling.  

3. Perform Several Types of Analyses to Improve Your Organizational Efficiency

Once you have an organizational data model in place to support your decisions on human capital strategies, you’ll be enabled to more easily perform several types of analyses to answer questions about optimizing your organizational structure.

One example of the types of analytics that can be easily performed once you have the right data model in place relates to the concepts of span and depth of control.

Span of Control

A valuable metric you can design analyses around is called span of control. At its most basic interpretation, span of control refers to the number of direct reports a supervisor or manager oversees.

For example, a manager may have five direct reports who are all individual contributors, therefore the manager’s span of control is five. This might seem straightforward at first, but extracting meaning from that data point can be difficult, and is where having an organizational data model can help.

Depth of Control

Span of control may seem straightforward, but depth of control is an extension of that concept. Whereas span of control typically refers to supervisor-to-direct-report relationships, depth of control takes into consideration the entire chain of command below a specific supervisor.

For example, let’s say the manager in the previous example reports to a senior manager, and is one of three direct reports for that senior manager. If each of those managers has five direct reports, the senior manager has a span of control of three, and each of his or her subordinates has a span of control of five. This also means the senior manager’s depth of control is 18—the three direct reports plus the 15 individuals who report to those direct reports.

The Benefit of Analyzing Span and Depth of Control

The value of an organizational data model becomes apparent when you start to consider both span and depth of control.

Without an organizational data model supporting your analyses, identifying the span and depth of control for more than a handful of any given employees at a time can be time-consuming.

When you need these numbers for a large populations or groupings of supervisors at the same level, doing the research without a data model is also a more error-prone task.

With an organizational data model in place, you simply query the data model for the span and depth of control of all employees meeting your analytical criteria and receive your answer in seconds.

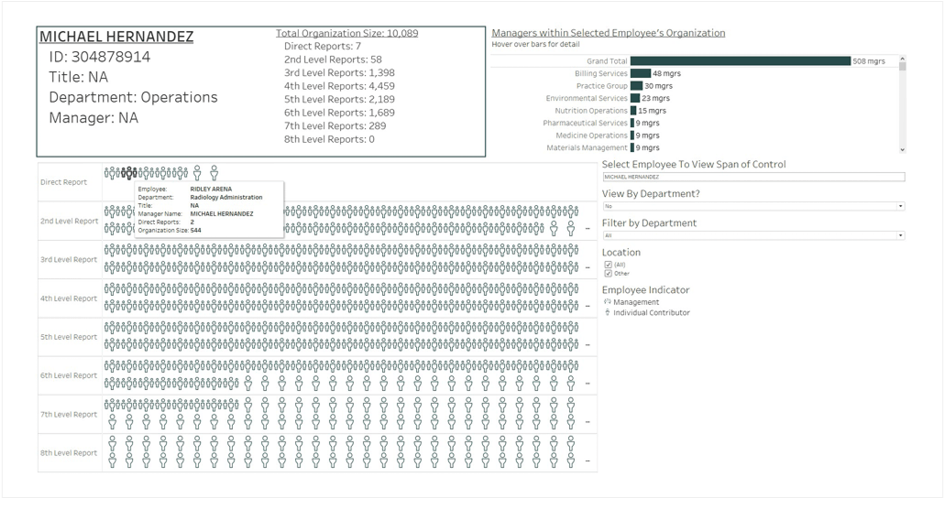
4. Consider Building a User Interface

If you take the extra step to build a user interface (UI) over the top of your data model—using tools such as Tableau or Power BI—you can unlock the capability of both technical and non-data savvy users alike to interrogate and analyze your organization’s human capital data.

building a user interface chart

Adding a user interface on top of an organizational data model provides both technical and nontechnical users the ability to easily interrogate human capital data.

How Organizational Data Models Can Improve Operational Efficiency

One of the most significant value-adds that comes with implementing an organizational data model is the elimination of onerous steps required to refresh measures and metrics every time an updated view is requested.

An organizational data model will always show the most current state of your key human capital metrics and free up time for more sophisticated analyses when it’s connected to a direct data feed from source systems.

These analyses will focus on diagnosing and treating symptoms of operational inefficiencies rather than just affirming problems exist.

Example

Let’s revisit span and depth of control metrics.

Consider a moderately sophisticated HR organization that’s actively monitored basic span and depth of control stats for some time. They’ve recognized the value in those metrics and tasked a business analyst with the responsibility for calculating and reporting them every month.

This analyst has the process down to a repeatable set of manual steps conducted over several days:

  • Request data from IT
  • Clean data in Excel
  • Run a few custom macros
  • Copy and paste basic metric results into a monthly reporting format
  • Review with managers
  • Distribute to business leaders in time for monthly reviews

This manual process is valuable in-and-of-itself. It outlines functional requirements that would act as a baseline for a more automated solution.

However, once the process has been established, the accumulated time spent repeating this process has diminishing returns in comparison to the types of new analyses that could have been conducted with that lost time.

Instead of spending several days in the second month manually recreating the same output as the first month, an organizational data model would enable you to spend time analyzing span of control through different dimensions such as business unit, job location, job level, tenure, or employee class.

In the next analytical cycle, you could break down those lenses into quartiles to understand the overall distribution of span of control across the organization.

By the fourth and fifth analytical cycles, you could have trends of past results over time to see where persistent issues exist; you may even begin designing prescriptive analytics to help determine which levers in your organizational strategy you can pull to positively influence the distribution of your span of control metrics and consequently improve your operational efficiency.

Compared to a fully manual process, the implementation of an organizational data model unlocks the ability to get solutions quickly—long before manual processes have been through enough cycles to diagnose the problems.

organizational table model

With an organizational data model, key measures, metrics, and KPIs can be monitored continuously and refreshed at the click of a button.

Increase Operational Effectiveness

Once armed with an organizational data model, decision makers will be able to take quick action to tangibly impact organizational strategy and operational effectiveness.

The previous outcome of past analyses —for example, simply calculating span of control metrics—becomes the new starting point of every future analysis.

Further, because an established organizational data model can be refreshed near-instantly, any time new data is provided—or better, in real-time when the model is connected to source data—the impact of actions can be seen almost immediately, and decisions on changes or course corrections can be made quickly.

This all coalesces into a strategic environment that empowers leaders to be more surgical and targeted with their human capital strategies.

Full-organizational restructures can be expensive and disruptive, and as a result can be wasteful if implemented when not necessary. Before making the costly decision to go forward with such an initiative, it’s important to conduct a thorough assessment of human capital issues to determine whether they truly warrant an organizational restructure or a more targeted solution.

The implementation of an organizational data model can reduce the effort needed to conduct that assessment by helping you bypass the data wrangling stage.

A built-out model will start with the metrics and analytics you may spend days or weeks calculating in a manual model. With metrics such as span and depth of control on hand at the start of your assessment, the organizational data model allows you to interrogate the data to answer questions about those metrics immediately.

With this tool at your disposal, you’ll gain insight as to whether the underlying cause of human capital issues is acute or systemic, temporary or chronic, and warrants a solution that is targeted or sweeping.

By quickly and acutely diagnosing the underlying issues, more targeted, and less expensive, corrective action can be taken.

organizational model exmaple chart

Organization models fed to visualization and analytic tools allow a user to quickly identify outliers in their data.
interactive organizational chart and table with data

Interactive interrogation of the data allows a user to quickly gain insights as to whether the issue is widespread or confined to a single area. In this case, all outliers appear to be in the nursing department, which helps leadership to strategically target initiatives to address the problem in that particular department, rather than the entire organization.

Pivot Your Work Environment Strategically

Across industries, many organizations are choosing to move forward with a remote workforce or a hybrid model of in-person and remote work. In this environment, leaders need to have immediate access to their organization’s configuration to assess if their structure supports their strategic plan.

Organizational data modeling is one way to create a data-driven, objective representation of your organization in to help provide instant access to empirical information.

The ability to quickly respond to changing circumstances with comprehensive and highly informed decisions is becoming more critical.

We’re Here to Help

To learn more about how to extract more value from your organization’s people information, please contact your Moss Adams professional.

Special thanks to Alex Luke, Senior, Data Analytics Consulting Services, for his contributions to this article.

Contact Us with Questions

Enter security code:
 Security code