
The pandemic-driven challenges of 2020 starkly revealed the importance of broadband internet to economic stability and growth. The forced shifts to remote work, learning, and entertainment accelerated the adoption of broadband-dependent strategies, a trend which continued throughout 2021.
Local internet service providers, including rural telecommunications carriers, excelled at responding to increased demand, providing important services to customers living and doing business within their service areas and beyond. Broadband internet remains an essential service and an integral piece of US infrastructure.
The Moss Adams 2022 Telecommunications Benchmarking Study provides important data and takeaways influenced by this economic landscape, enabling you to assess where your business ranks against other telecommunications companies in key industry areas.
2022 Benchmark Methods
The study compiles 2021 data from 115 companies. Participants comprised 55 cooperatives and 60 privately held businesses.
Participants came from 41 states and included 70 companies under legacy rate-of-return and 45 companies under model-based support—ACAM I, ACAM II, or Alaska Plan.
Participating Companies
Companies of all sizes participated in the study, as the following table illustrates.

The study defines a customer connection as a physical connection that provides service to a residential or business customer.
Often, one customer connection provides multiple services such as voice, internet, and video; however, for the purposes of the study, such instances counted as one connection regardless of the number of services one customer connection might carry.
This review of the benchmarking data focuses on:
- Broadband internet
- Staffing resources
- Network investment
- Overall profitability
Broadband Internet
The availability and reliability of high-speed broadband internet continues to be essential to life in the United States, particularly people and businesses in rural areas.
Video conferencing continues to be commonplace, and education, work, entertainment, and more rely on robust internet services. This continues to remove or mitigate barriers to remote working arrangements, remote education, and other opportunities for individuals and businesses to overcome geographic restrictions that previously existed and limited flexibility.
Broadband Growth and Fiber Optics
Circumstances in the rural telecommunications space continue to foster significant customer growth, speed tier upgrades, and investment in fiber optic network facilities.
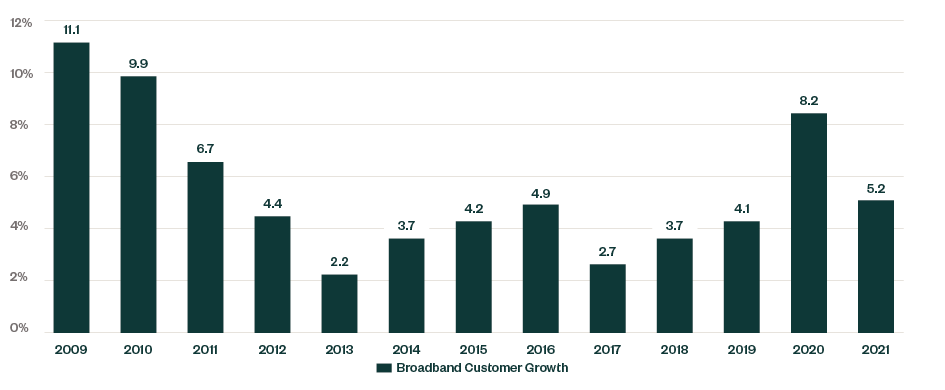
The graph below shows that the median benchmarking study participant experienced 8.2% growth in broadband customers from 2019 to 2020, followed by 5.2% growth from 2020 to 2021. This marks the highest two-year customer growth percentage in the more than 10 years since the transition away from dial-up internet to DSL.
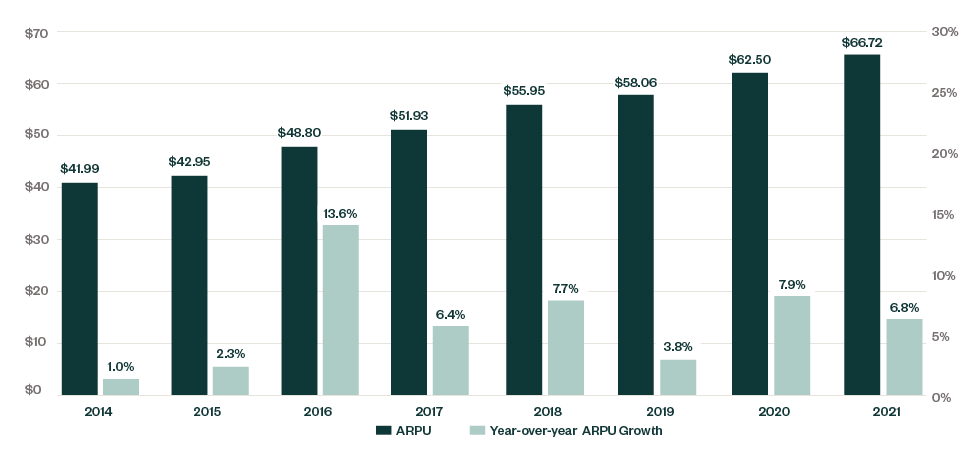
Customers were added and existing customers upgraded services to higher speed broadband packages. This is partially evidenced by the increase in broadband customer average revenue per user (ARPU) from $62.50 in 2020 to $66.72 in 2021—a 6.8% increase.
Continued deployment of fiber optic network facilities made this growth possible—see more on network expansion below. The median company reported that 77% of its residential customers had fiber connections to the premises.
This expansion of fiber to the premises not only allows for increased download speeds, but also increased upload speeds—essential for quality video conferencing performance, gaming, and other activities.
More symmetrical service offerings are available—for example, same download speed as upload speed, such as 100MB download by 100MB upload. Typically, upload speeds reach only a fraction of available download speeds.
The table below details the median company’s symmetrical versus asymmetrical broadband service offerings and the subscribers’ mix.

Although symmetrical service offerings total nearly one-third of the median company’s broadband options, only 15.7% of customers subscribe to these. However, this is a substantial jump from the 10% in the prior year.
Specific to the number of speed tier service combinations offered by companies to customers, the median company reported offering eight combinations, with over 75% of all companies reporting four to 12 offerings.
The most common service package subscribed to by customers in 2021 was a symmetrical 100Mbps service, totaling 10.33% of all broadband customer subscriptions. Other common service packages were 25Mbps download/3Mbps upload at 8.32% and 100Mbsp download/10Mbps upload at 7.62%.
Voice Data vs. Broadband Only
Another continuing significant trend in the rural telecommunications industry shows movement away from selling broadband internet with a phone line, or voice data, to selling broadband as a stand-alone service, or broadband only.
In total, broadband-only customers in the benchmark study totaled approximately 33.4% of all broadband customers. This indicated a 2% rise from the prior year.
Comparing legacy rate-of-return carriers to elected model-based support—ACAM I, ACAM II, or Alaska Plan—further illustrates the trend. This is a logical result due to the added support that legacy rate-of-return carriers receive for broadband only customers, whereas model-based support carriers receive no additional support while losing the local revenue. There’s less incentive for model-based support carriers to offer broadband-only services.
The median legacy rate-of-return carrier reported 42.1% of its broadband customers as broadband only compared to 16.8% reported by carriers under model-based support.
Staffing
Staffing costs have long been the single largest cash expense to rural telecommunications carriers. The challenges of 2020 and 2021 required companies to find creative solutions to provide a safe working environment for both customer-facing and back-office employees, while maintaining continuous focus on efficiency.
The benchmarking study traditionally used revenue per employee to compare employee efficiency across study participants.
The graph below shows the 10-year trend in total revenue per employee.
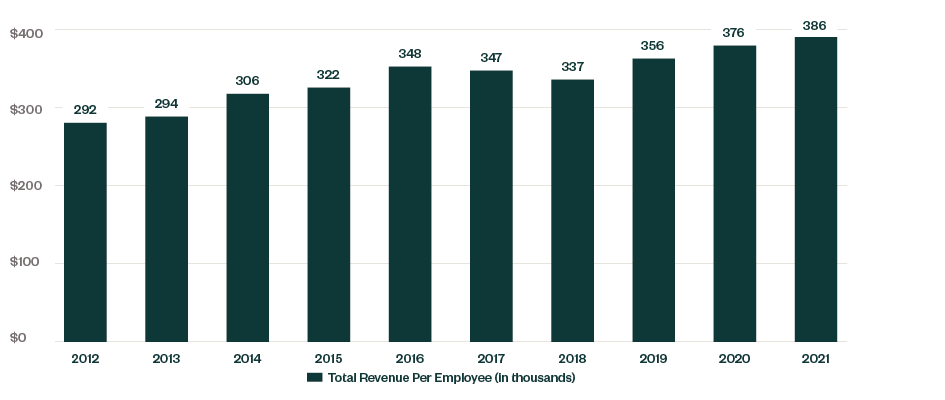
Total revenue per employee continues to trend upward; however, Universal Service Funding (USF) support revenues and other revenues not necessarily employee-driven can influence that outcome.
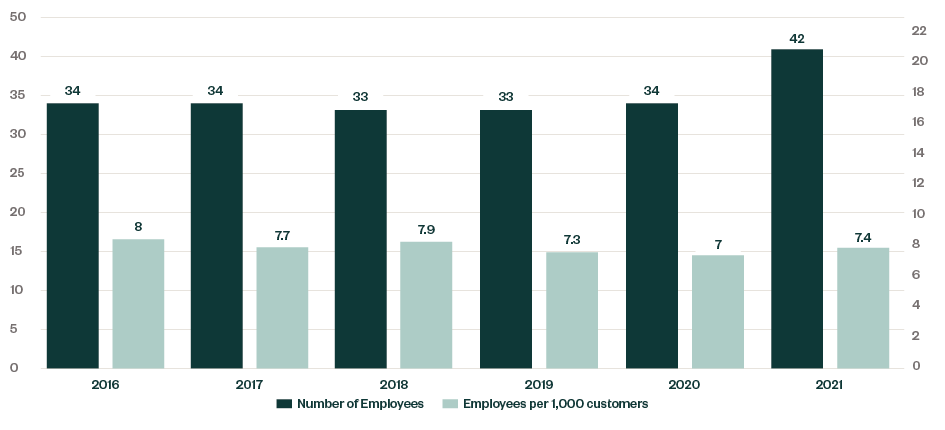
A new metric introduced in the 2020 survey compares the number of employees to customers.
The graphic below overlays the median number of employees with the number of employees per 1,000 customers throughout the past five years. As this number dropped from eight employees per 1,000 customers in 2016 to just over seven in 2021, the data appears to support that companies realized some efficiencies in serving customers over the past several years.
Network Investment
Rural telecommunications is capital intensive. The median company reported the per connection gross network investment at $10,765, however, this figure is down from $12,152 in 2020 which was a peak year over the past 10 years.
Companies continue to deploy fiber to the premises throughout their networks, however, there was a slight slowdown in 2021 as compared to the peak year of 2020—which saw an increase in network spending compared to previous years.
The graph below presents the median of network investment as a percentage of total company revenues on top of the total gross investment per customer connection for the same period.
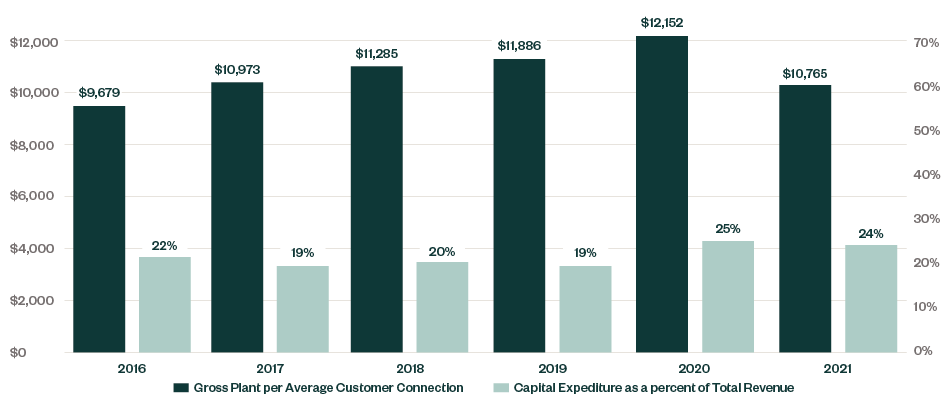
This level of investment, in terms of as a percentage of revenue, hasn’t been seen in the rural communications industry since before the Federal Communications Commission’s (FCC) 2011 USF/ICC Transformation Order, and points to the ongoing need for network investment to meet the FCC’s ever-expanding requirements of voice and broadband providers.
Capital investment will likely be greatly impacted in 2022 by federal funding made available under the Infrastructure Investment and Jobs Act and other infrastructure funding programs.
The 2023 benchmarking study will include metrics to measure this unique network capital source to compare internally funded expansion activities to externally funded expansion.
Profitability
The industry again experienced strong profitability results in 2021; albeit slightly down in operating income before depreciation and amortization (OBITDA) and operating margins from 2020—and that’s whether you use operating margins, earnings before interest taxes depreciation and amortization (EBITDA) or OBITDA.
Thirteen percent growth in broadband internet revenues bolstered profitability while maintaining 2020 levels of federal USF. Specific to USF, interest has risen in evaluating a company’s profitability excluding federal and state universal service support—EBITDA-less USF or controllable margins.
Companies want to prepare for a future with less or no USF given the persistence of caps on federal USF, such as budget control mechanisms, per line caps on support, expense limitations, and other constraints.
The graphic below shows the median company’s profitability figures along with EBITDA-less USF for the past five years.
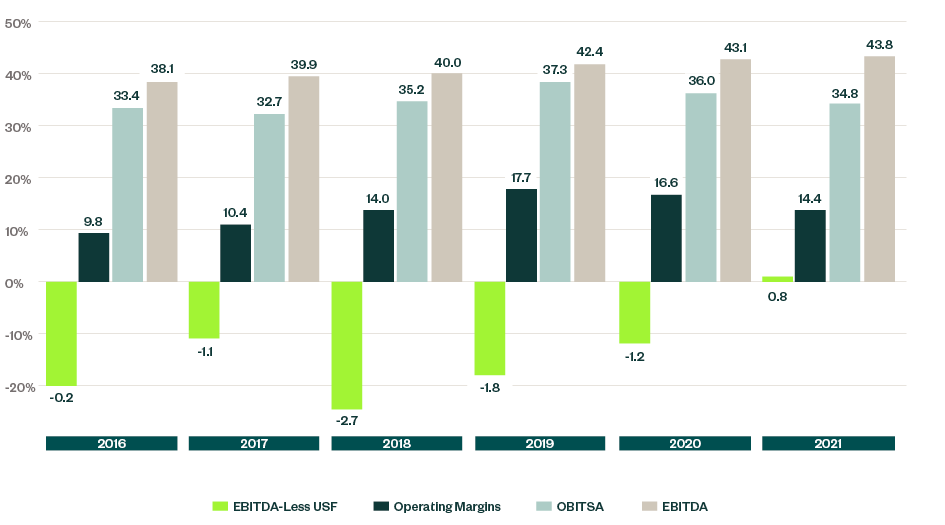
As noted above, the median company reported positive EBITDA-Less USF for the first time.
The following table provides more details including bottom and top quartiles.
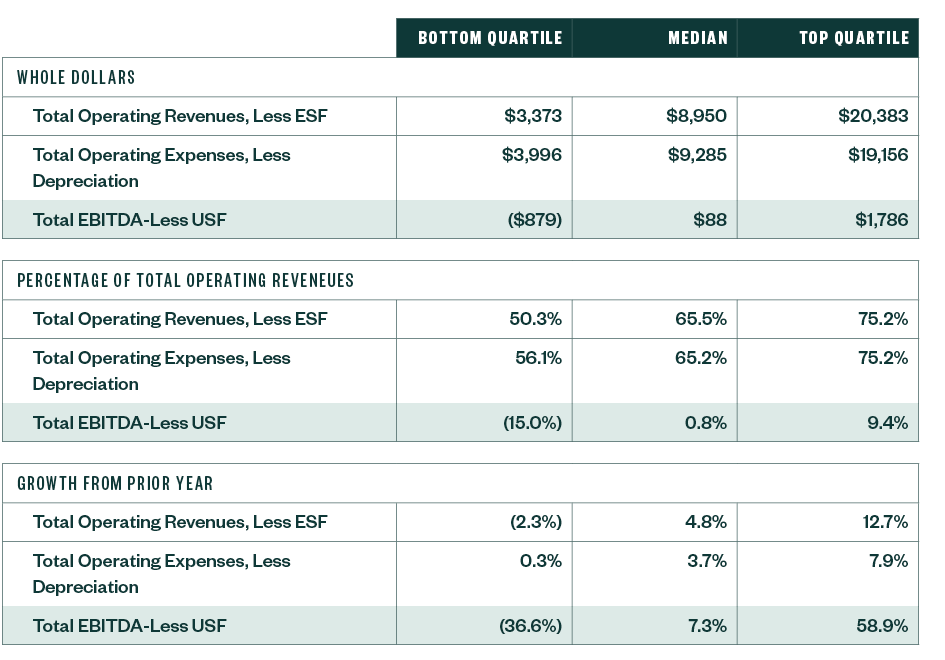
Although it reports a negative EBITDA-Less USF, the median company appears to be improving in this area, showing a 7.3% positive change from 2020 to 2021.
We’re Here to Help
For more insights on how your company can navigate the current landscape, contact your Moss Adams professional.
You can also visit our Communications & Media Practice for more information.