Save Time and Derive Better Insight from Your Data with Financial Dashboards

With the ever-changing business environment, being able to connect the right business data with strategic business decisions is increasingly critical.

Data visualizations and dashboards are changing the way we access, view, and analyze organizational data. This is especially true in accounting and finance roles. Tapping into the potential of your business’s data can deliver major value, but without the right tools, you could miss out on discovering important insights.

Modern visualization software tools such as Power BI and Tableau could transform your manual spreadsheet-based processes into a highly automated and streamlined set of dashboards and reports.

The following is a breakdown of common data issues in the accounting environment and how dashboards can help you solve them, save time and money, and derive deeper insights from your data. 

The Challenges You Face

In the accounting environment, extracting data, assembling spreadsheets, and creating reports are all common occurrences.

Many accountants rely on spreadsheets because most individuals in the space are familiar with them. They can be a great way to run short, one-time, or experimental processes; however, they also come with significant drawbacks.

Reporting Requirements Often Snowball

Problems can arise should you become a victim of your own successes with spreadsheets. If you create value by making a spreadsheet, it’s likely you’ll be compelled to repeat that process to generate more value.

Frequently the process or report grows to include other factors and becomes more complex over time. While this isn’t a problem per se, the issue is that often as reporting requirements increase, they can begin to take up more time than originally intended. This often happens gradually over a period of time, so the impact isn’t felt until you find yourself spending 40-plus hours a month generating reports.    

Lengthy Reports Can Introduce Errors and Risk

As the amount of time spent on manually manipulating data increases, so does the potential for error.


Many accountants rely on spreadsheets because most individuals in the space are familiar with them. They can be a great way to run short, one-time, or experimental processes; however, they also come with significant drawbacks.

Add in modern distractions, competitive pressures, increasing work tempo, remote-work—and you have a recipe for important operational cues to be missed, or worse, a loss of trust in an individual or a process. Over time, this can lead to significant issues. 

Benefits of Dashboards

Regardless, spreadsheets are here to stay, and there will always be a need for the one-off processing they enable. However, many of their functions can be replaced and improved by dashboards.

Visualize Trends and Insights

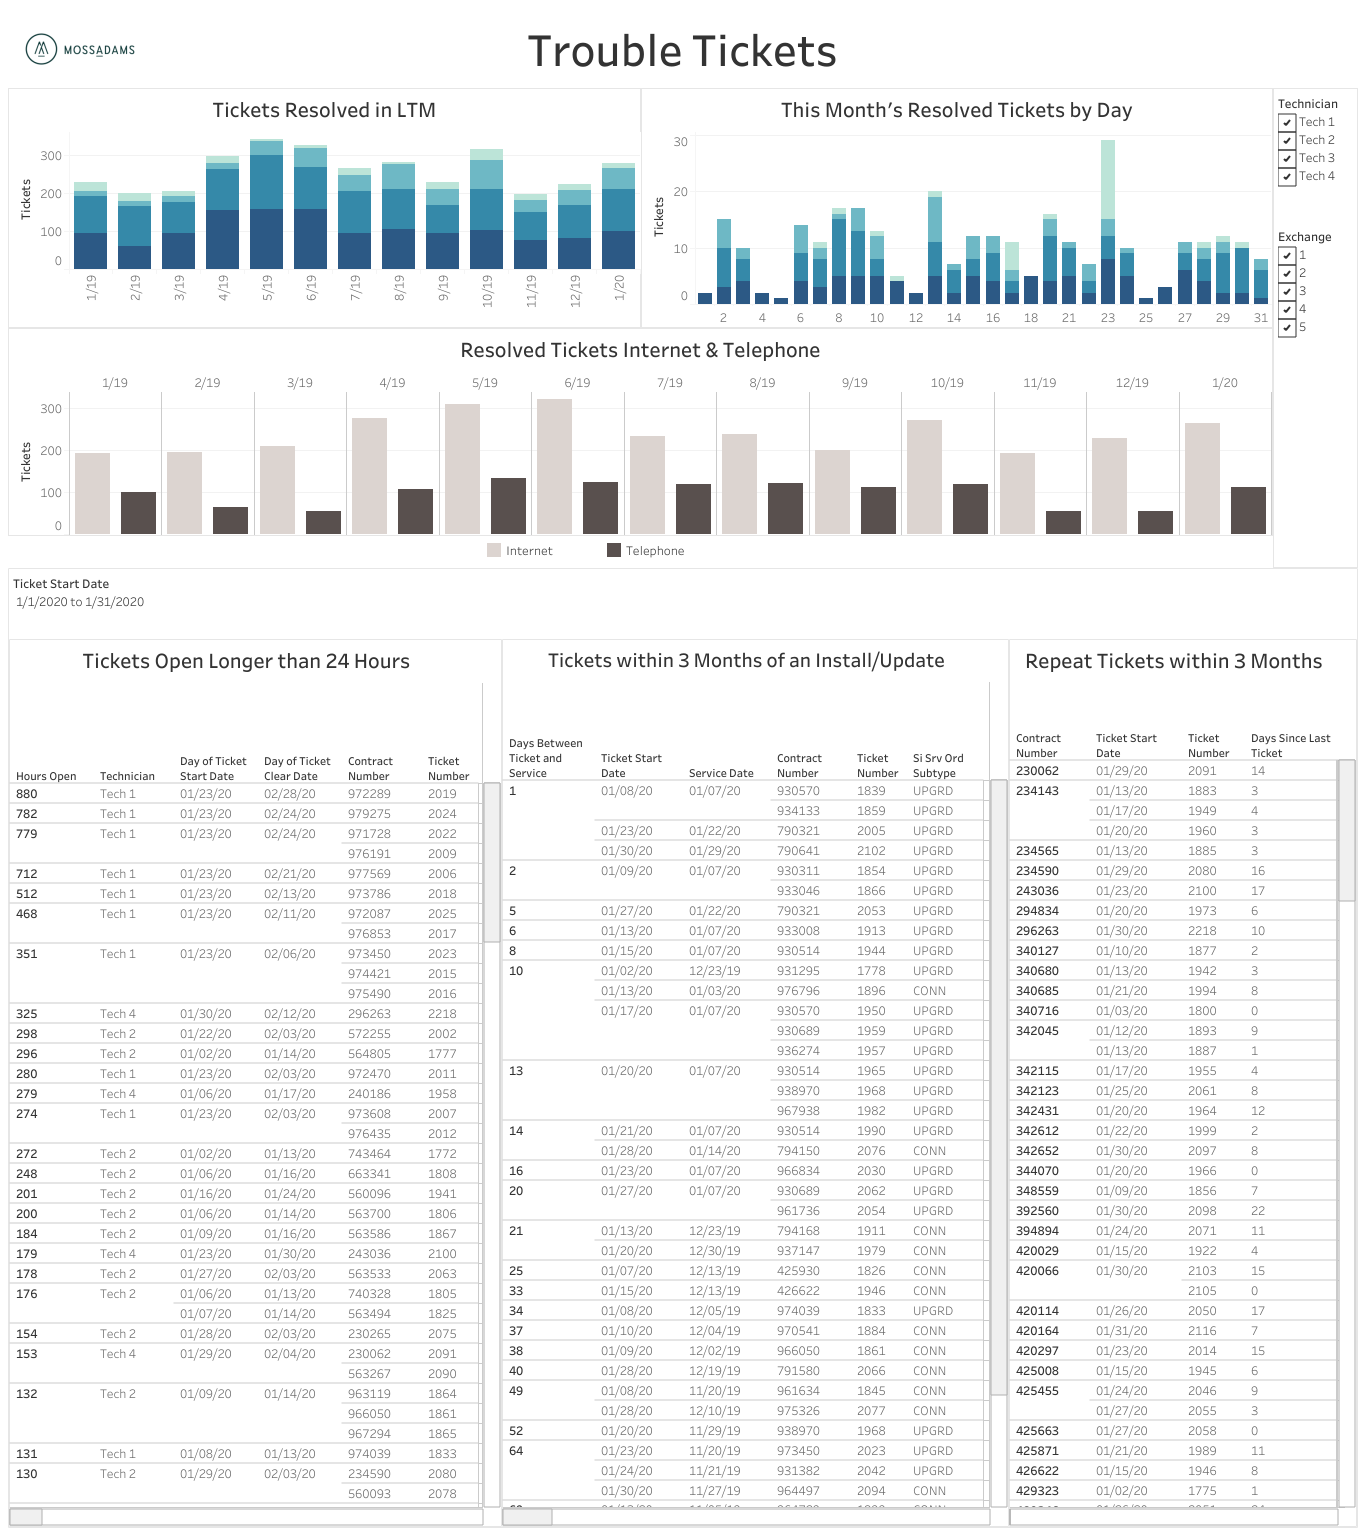
Dashboards allow you to visualize trends over time and track any spikes or dips, which can be more meaningful than simply looking at raw numbers.

Additionally, depending on the source of the dataset, you can easily drill down to the most specific level of detail, whether it be the account balance, journal entry with header information or line item detail, or even customer-level insights.

When utilizing data visualization software and dashboards, all your financial data is conveniently connected and stored in one place for easier accessibility. For example, you may currently produce multiple sets of financial statements for your various companies and subsidiaries separately. With dashboards, you can access and visualize this data at once and instantly change selections or assumptions. This can improve efficiency for your team.

The following are examples of how dashboards can provide summary data across many functions and drill-down capabilities.

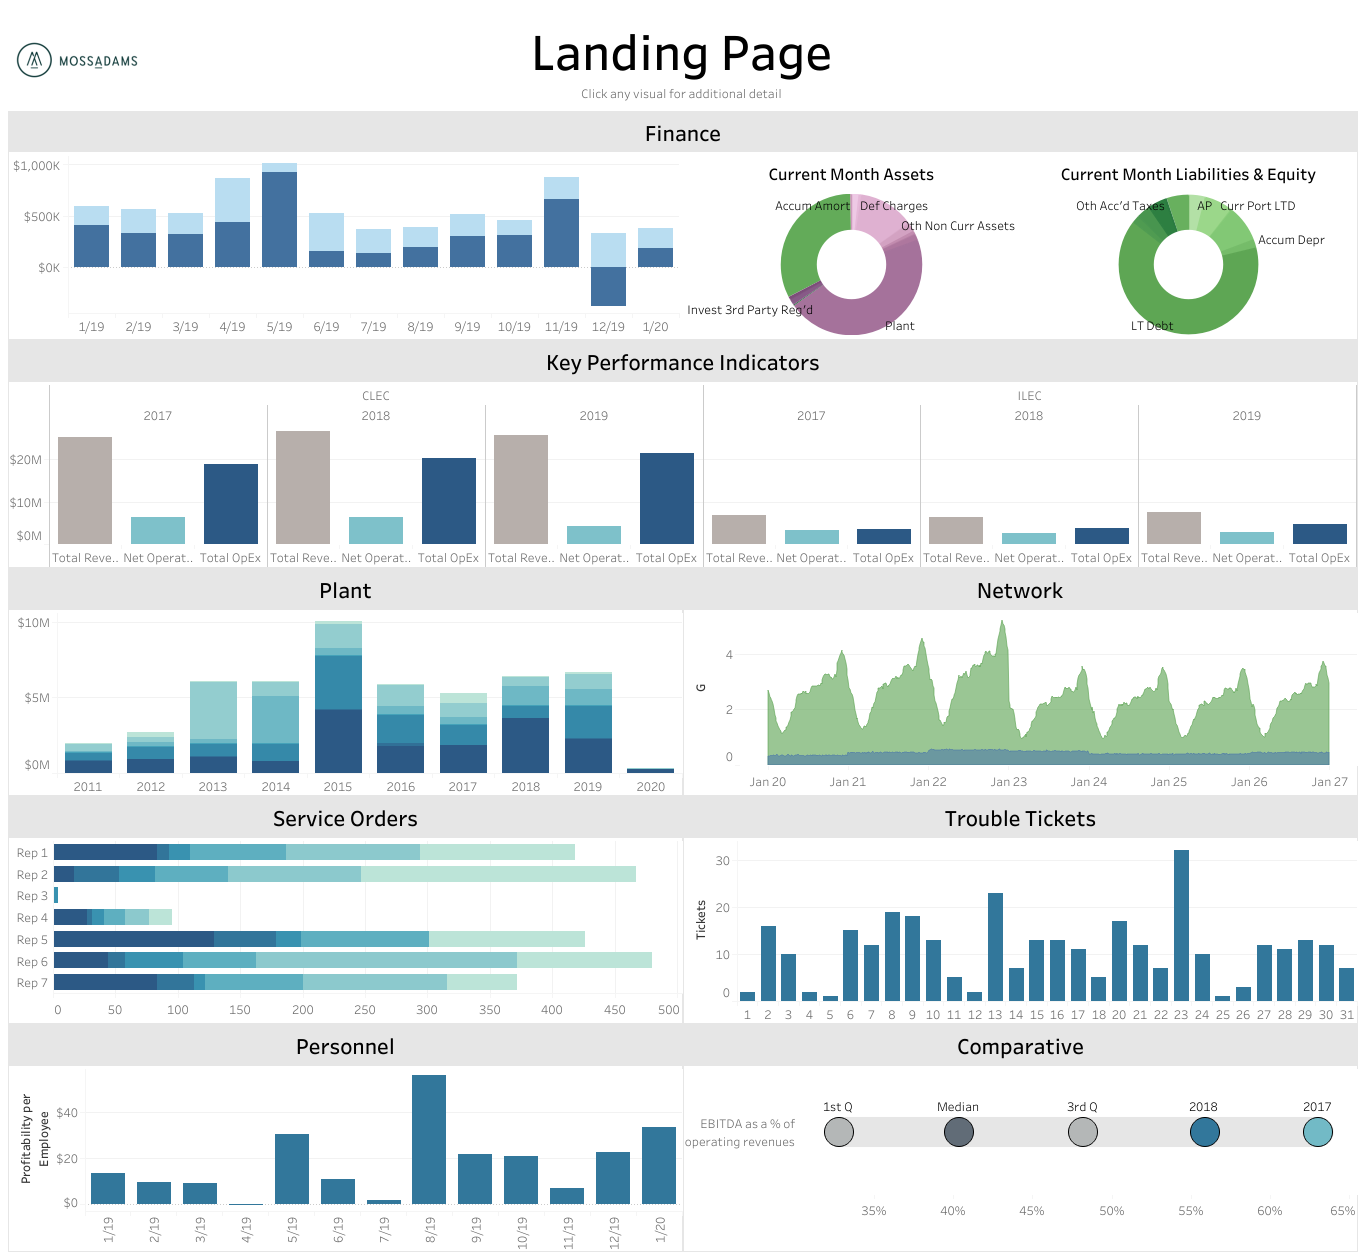
A landing page can reveal cross-functional insights as well as provide a clear path to accessing these datasets.

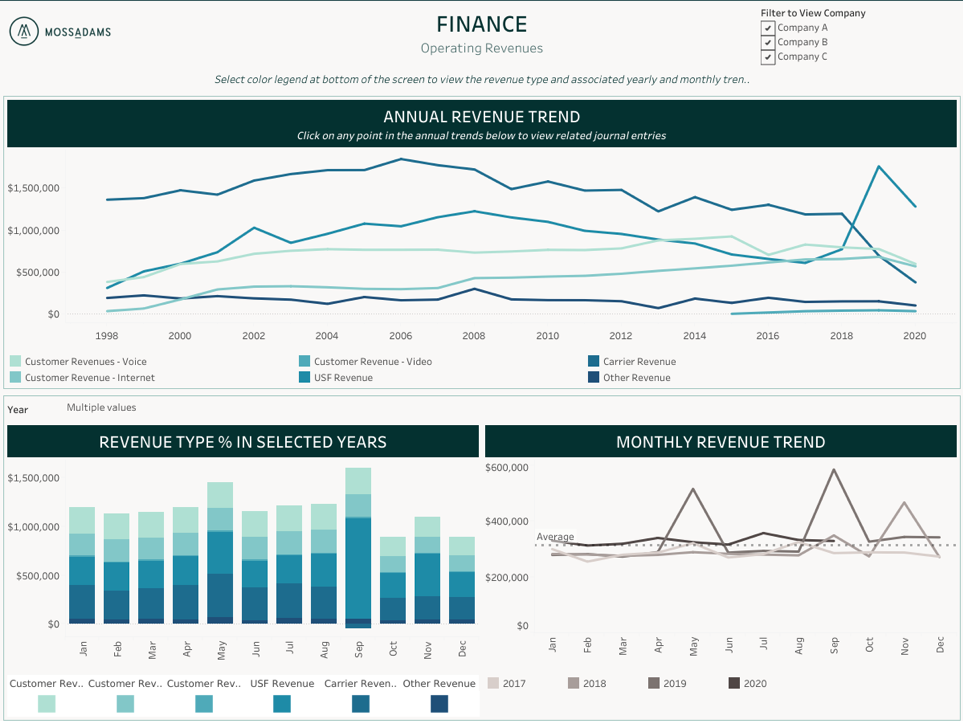
Here’s an example of a financial dashboard tracking select revenue metrics that also permits multiple divisions or companies to be viewed together or individually.

Dashboards let you track and view trends to meaningfully report on data, while easily accessing its source.

Tap Unused Data

It’s likely that your organization has a large amount of unused data. Some of it may be old, unusable, or irrelevant to the present need, however, other data may help you arrive at deeper insights.

With spreadsheets, it’s too time-consuming to sift through data that isn’t current, but a dashboard can provide instant access. This means data that can offer valuable insight isn’t left out of your reports.

Adaptability

With a data project, once you have a dashboard that surfaces clear and reliable data, you’ll have more options for deeper and more creative data analysis and reporting. Because dashboards can grant you immediate access to current data, you can then quickly report on your business’s current state. This can free up time to use your experience and judgement to solve other problems and ask more complex questions.

Another benefit of assembling a set of dashboards for any part of your company is that the data sources can provide you additional insight—often to questions that have yet to arise. The creation of a data source to accurately report on revenues, expenses, and customer count, for example, can be leveraged to build new dashboards. This can lead to better business intelligence about plant expenses; selling, general, and administrative (SG&A) costs; key performance indicators (KPIs), and more. 

Some of these new areas of analysis will probably result in new dashboards, which can provide the opportunity to derive even more value out of your current system. 

Other areas of inquiry may be simple one-off thoughts, an analysis that you might’ve previously figured out with a spreadsheet—or perhaps didn’t attempt because it would’ve taken too long without a dashboard. These ad-hoc type of analytics are also useful because it can give you access to multiple sources of proven data instantly. As a result, you get an answer to your quick question with context. The ease of this process will lend itself to you getting more answers to your questions.

Automation

These two types of automation can ultimately lead to time savings and a reduction in human error. This includes any potential errors relating to manual data entry, calculations, or compilations in your reporting process.

Connection to Data

Once you’ve created a data source or connected to an existing one, the next connection will continue to be automatic from that file. This means, the foundation will be in place before you get started.

If going into multiple data sources is a difficult and time-consuming process, this can save you countless hours of obtaining and aligning the data.

Refresh the Connected Data

Any changes in the data will automatically update and appear in the dashboard as it refreshes. This means automated dashboards or reports won’t require a lengthy process to manually retrieve the latest data from the system.

For example, connections to your general ledger account data can be set to automatically refresh the data as the data changes, on a schedule, or when the dashboard file is opened.


These ad-hoc type of analytics are also useful because it can give you access to multiple sources of proven data instantly. As a result, you get an answer to your quick question with context.

Additional features in both Tableau and Power BI allow you to schedule data refreshes for times when your company systems are most available, such as in the middle of the night. They also allow you to receive updated reports by email, so for instance, you could have a status report on your top five metrics emailed to you 10 minutes before the start of every workday.

How to Transition to a Dashboard

Some companies have teams dedicated to setting up and running data systems and analytics, but many don’t. If the latter describes your organization, here are some steps to help you get started:

1. Evaluate your systems and needs. 

Taking time to get a thorough data assessment can not only help you make the most of your data systems and set priorities for your reporting needs, but it can also help you derive the most value from work you do or have done. 

2. Determine how much time you and your staff spend on data transformation and reporting. 

Often these processes are essential to your business, but they’re also the most time consuming. Automating these processes might be the biggest savings you can make by using data over the near-term.

3. Replace any reporting with an automated dashboard or process. 

When discerning whether or not to automate a process there is a common sentiment that can be useful in guiding your decision: If you have to do it once or twice, do it manually; if you have to do it three or more times, find a way to automate it.

An automated process can benefit you by saving time and reducing the likelihood of human error.

4. Start with your finance team, then branch out into other parts of your business.

It seems that everyone wants a better way to understand where their resources are allocated. Getting started with financial dashboards is a great way to save time and gain a deeper understanding of the data you have, make the most of your data, and empower leaders to make data-driven decisions.

It’s common for a company to expand beyond finance data once its leaders have experienced the added benefits of automation and visual analytics. In many cases, dashboards can be used to conduct status updates, giving leaders instant access to the full capability of their data.

We’re Here to help

Explore our free tools and articles to help you navigate your data journey to becoming a data driven organization.

To learn more or to start creating a dashboard specific to your organization, please contact your Moss Adams professional.

Special thanks to Irene Ng, Senior, Data Analytics Consulting Group for her contributions to this article.

Contact Us with Questions

Enter security code:
 Security code