


Modern reporting, automation, and business intelligence (BI) tools such as Power BI and Tableau can give managers throughout an enterprise better access to their organization’s data and help save time and resources.
Unfortunately, many power and utility organizations’ current enterprise resource programs (ERPs) lack modern BI functions and make it challenging for staff to leverage their data to its full potential.
To evaluate your operations and its relationship with data, explore insights based on results of a data survey of organizations across the industry, as well as steps your organization can take to enhance its data operations.
Survey Background
In the power and utility space, teams within different companies expressed different visibility and capabilities into their own internal information and data.
In many cases, ERPs were created in an evolutionary and siloed manner. However, finding insight and accessing information in a timely fashion requires compiling data from different areas of the enterprise to enable decision making.
Fortunately, modern visual analytics platforms, can often integrate these disparate data systems together into one seamless and usable dashboard.
Here’s what respondents revealed along with some insights on their feedback.
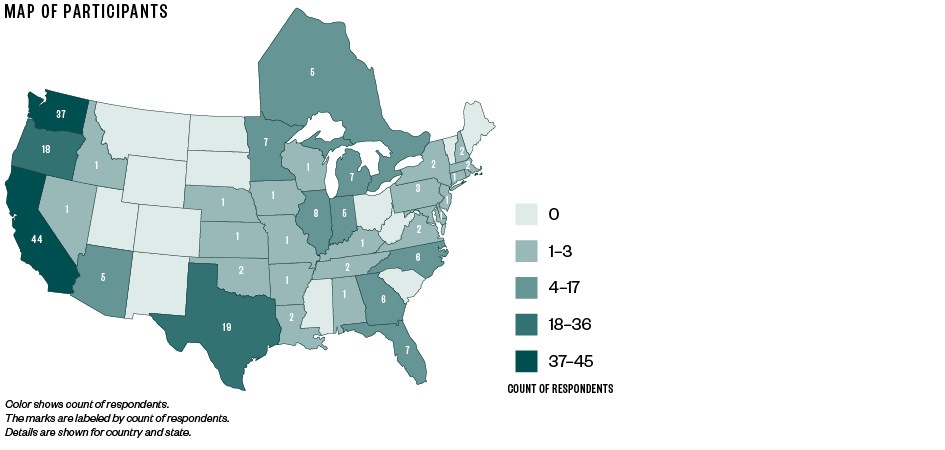
Respondent Details
The survey gathered information from:
- 131 respondents
- 52 team members from a utility
- Participants from 38 states, plus five from Ontario, Canada
Among job titles, several were in key leadership or financial roles including:
- 11 presidents, CEOs, or general managers
- 72 controllers or CFOs
- 66 other accounting team members
While not a large survey, there’s still value in understanding how peer companies approach their data analysis tools.
Insight on Data
Here are the questions asked and a breakdown of responses.
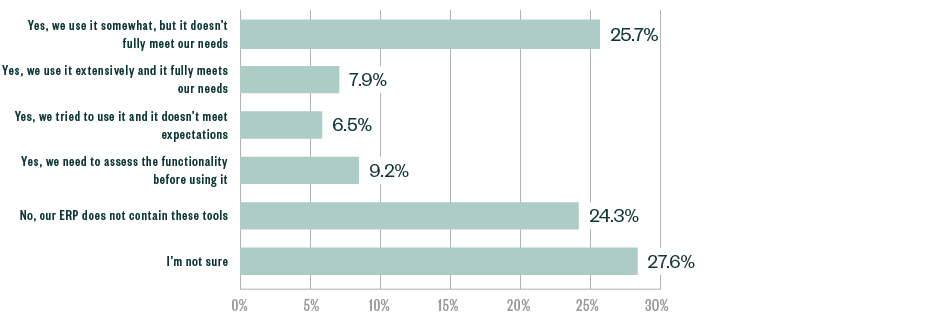
1. Does your current ERP platform contain data analysis and visualization tools?
It’s quite telling that the majority of respondents don’t understand what their platform can do or have a system that doesn’t meet their needs.
Most ERP platforms lack data analysis and visualization tools, or the off-the-shelf tools that it possesses aren’t customizable to meet the company’s needs. These drawbacks can result in lost time as well as monetary and personnel resources.
Notable insights include:
- 27% aren’t sure if their current ERP platform contains data analysis and visualization tools
- 26% use their platform somewhat, but don’t believe it fully meets their needs
- 25% have systems that don’t provide these tools
Notably only 8% are satisfied with their system; they use it extensively and it meets their needs.
While assessing your current systems is perhaps a good starting point, it might not support all your needs as a data-driven organization. Enterprise systems are often only relevant to one type of data or are built in a siloed fashion. This means they don’t easily integrate each aspect of the business into one system to inform decisions.
For example, some ERP systems provide data insights for billing and accounting, but separate systems or tools are needed to monitor customer services, network operations, and personnel.
Upgrading to a more robust system may be a worthwhile investment in some cases if it can help you streamline your data, save time reconciling reports, and lead to overall increased efficiency.
In most cases, a modern visualization platform can access all the data available from various parts of the enterprise system, or multiple systems, and compile it in one place for management viewing and decision making.
2. Which types of data do you believe would provide the most value to your utility?
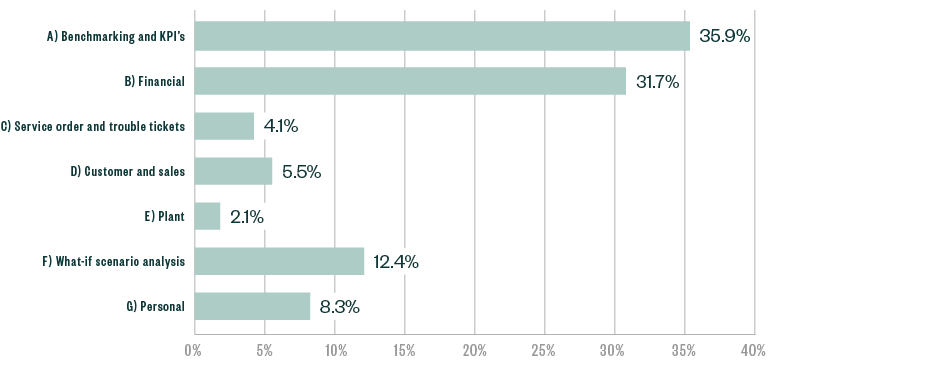
By far, respondents felt that benchmarking and key performance indicators (KPIs) (36%) and financial data (32%) are the most significant value to their utility. The remaining five responses include what-if scenario analysis data (12%), personnel (8%), customer and sales (6%), service order and trouble tickets (4%), and plant data (2%) and sum to about 34%.
Creating and tracking KPIs from across your team is the essence of being a data driven organization. For example, financial status, bond payments, project progress, and board direction can be calculated and displayed, often from currently available information.
The use of modern, flexible tools can help you automate these measures and change them as you move towards your goals.
The value of certain types of data varies with management style and from organization to organization. For example, some teams focus on reducing time-to-service, while others plan network growth, broadband development, micro generation, or time-of-day pricing.
In all cases, robust, flexible access to your information and strategic methods to consume it are essential.
The value found in some sources can be a surprise as well. Personnel, the least selected category, can often lend more insight than companies realize—especially when integrated with other company data.
When different types of data are captured and reported separately, it can result in inefficiencies, inconsistencies, and a lack of centralized information needed for responsive and collaborative decision-making across departments. This is one reason why an integrated, real-time data system is key to leveraging your data successfully.
Learn how to improve in this area by accelerating your human capital strategy with an organizational data model.
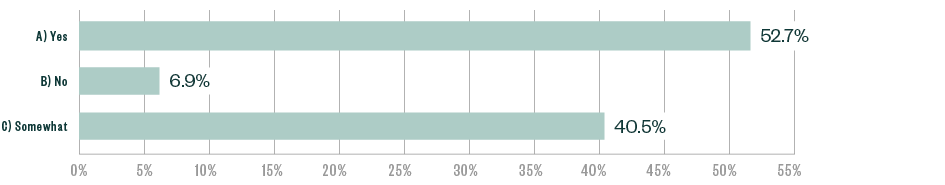
3. Do you believe your company collects sufficient amounts of data to become more data-driven?

Nearly half of respondents feel they gather sufficient amounts of data but it’s not accessible for decision making.
This is followed by nearly 34% feeling satisfied the data exists and their tools provide real-time insight. At the lower end, nearly 18% of respondents feel they don’t have a sufficient amount of data.
This data is consistent with trends; most teams feel there’s either not enough data available or it’s not accessible. This is simultaneously a significant problem and opportunity for those teams to add capabilities around accessing the data.
Many companies that feel they have solid or somewhat sufficient data might not realize the powerful tools available to help them better leverage their data.
Modern reporting, automation, and BI tools such as Power BI and Tableau can give managers throughout an enterprise better access to their organization’s data. The automation features in these systems can also save time.
Learn more about how and why to incorporate data analytics into your organizational thinking.
For those who responded or identify with those who said “No,” and don’t collect enough data, it may be useful to have an outside party assess how to capture and derive strategic value from the extensive data available.
A main reason organizations don’t invest the time and money in collecting data and becoming data-driven is they don’t understand the benefits their own, or, comparative data can have on operational efficiency and decision-making.
4. Does your board leverage data to make decisions and affect strategic change?
There’s been a recent boom in the use of more empirical measures by boards in a variety of industries.
This trend will likely continue as teams begin to look for better ways to measure their business and communicate the data at hand.
Implementing some level of dashboard or automation can add value to this process by being the always on, one source without requiring extensive work to prepare.
Additionally, modern data and visualization tools often allow teams and boards to view information over a much larger time horizon, allowing for longer range plan-to-actual assessment and historical perspectives to be captured and quantified.
Power and utility companies can take steps to help improve how they leverage data, including:
- Find a point person to drive data decisions and research
- Conduct a data assessment with an outside organization
- Hire professionals to set up a strategy for becoming a more data-centric organization
- Leverage integrated data systems that allow for real-time analysis
Next Steps
Getting the most from your ERP can be challenging, and these systems can be confusing. Across the board, it’s clear that most respondents are missing an opportunity to gain insights quickly and efficiently from their data.
To help accomplish this and derive more value from your data, it’s worthwhile to invest the time and money in finding the right system. To get started, look for a system or third-party advisor that can:
- Use modern tools to integrate all your data in one place
- Provide real-time, not static insights
- Offer customizable settings and dashboards so you track what’s relevant
Learn more about what type of ERP system is right for your company in our article or webcast.
We’re Here to Help
For a data assessment or assistance helping your power and utility company become more data-savvy, contact your Moss Adams professional.
You can also learn more about our Data Analytics Consulting Services