


Finance is always becoming more complex with organizations harvesting data from increasingly disparate systems. This data must be consolidated for data analytics that answer questions from across the organization.
Data needs to be cleaned, validated, then added to a report before it can truly be analyzed. Moving away from manual data analytics processes where human error can easily be introduced, is a good idea. Instead, automate your data analytics tools to analyze your financial metrics in real time.
Explore how you can start automating and streamlining your organization’s approach to data analytics.
Data Strategy and Management for Finance
Organizations struggle with the ability to acquire, manipulate, and store their data, which requires them to build costly data strategy solutions and write custom code to query, transform, and store it in their data warehouse.
With Domo, a data analytics platform, companies can spend less time poring through spreadsheets and pivot tables. Instead, they use Domo’s data visualizations and dashboards to analyze metrics key to their success.
To do this, companies use Domo's built-in data warehouse to store data along with over 1,300 pre-built connectors to pull data from a variety of relevant sources including cloud apps, database servers, and spreadsheets.
Data Analytics Hurdles in Finance
While data analytics has dramatically improved, usage by finance departments and organizations has lagged. Several factors could impact an organization’s data analytics processes. However, there are two main obstacles that impede finance departments and organizations as they look to implement better data analytics.
Finding the Right Data Set
First, finance departments and organizations struggle to obtain, access, or understand the data needed to perform their work more efficiently. The best way to tackle this issue is to start with data the department or organization is already comfortable with. Data that you're already using within spreadsheets for your periodic reconciliations and analysis is probably the best place to begin.
Creating a Data Strategy and Analysis Process
Second, organizations struggle to harness the data and develop effective visualizations and tests to improve their finance processes. For this issue, it’s best to take a phased approach when implementing an analytic solution. Through this method, all key stakeholders can stay focused on what data strategy framework needs to be implemented and use a more agile approach.
Domo’s analytics and reporting tool can help departments build more refined processes for data analytics and their reconciliation processes. Data analysts and implementation professionals have developed an extensive library of pre-built Domo data visualization tools that finance departments can use to start clarifying their data analytics processes.
Domo Dashboard Implementation
The below roadmap has worked well when implementing a new data analytics and visualization into an organization’s finance and accounting processes.
Phase One
Define the data analytics goals and set your foundation:
- Identify and train staff with an interest in analytics
- Obtain data to analyze
- Develop Domo cards and pages
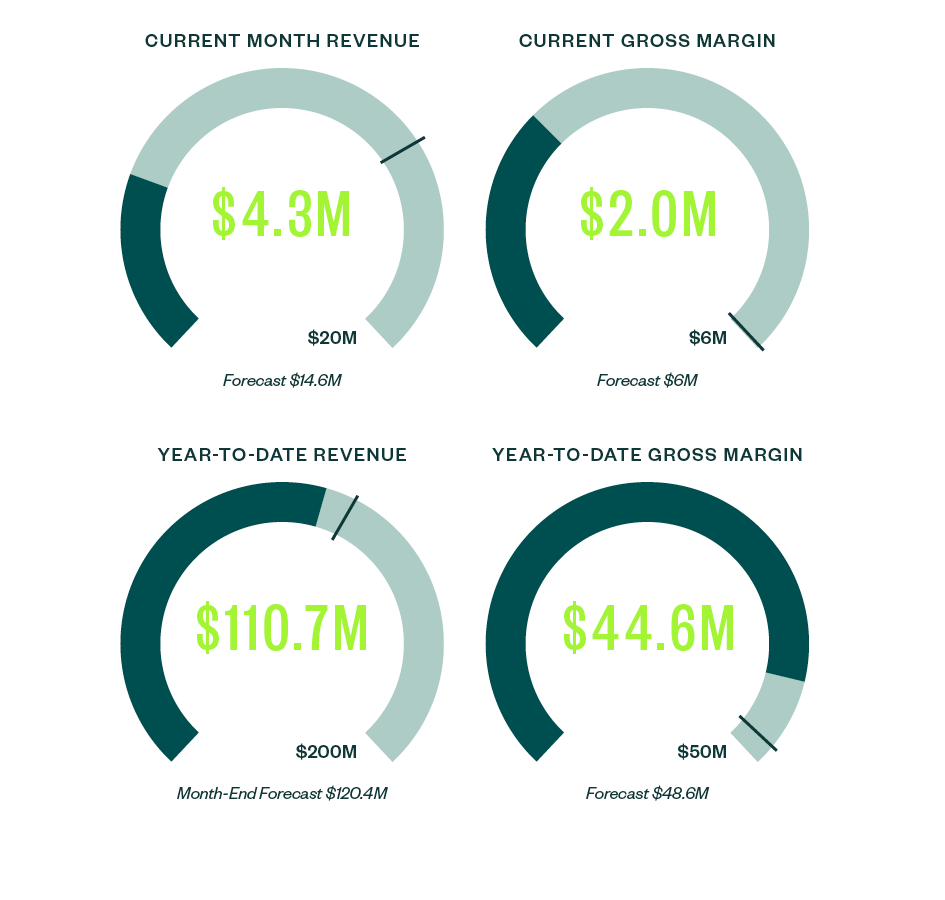
As this is early in the data analytics platform lifecycle, it’s best to focus on the key metrics that drive your business and build those as your primary visualizations.
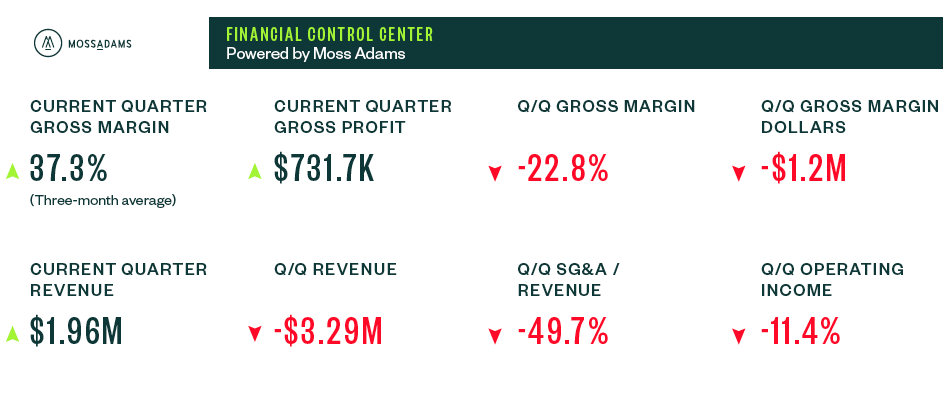
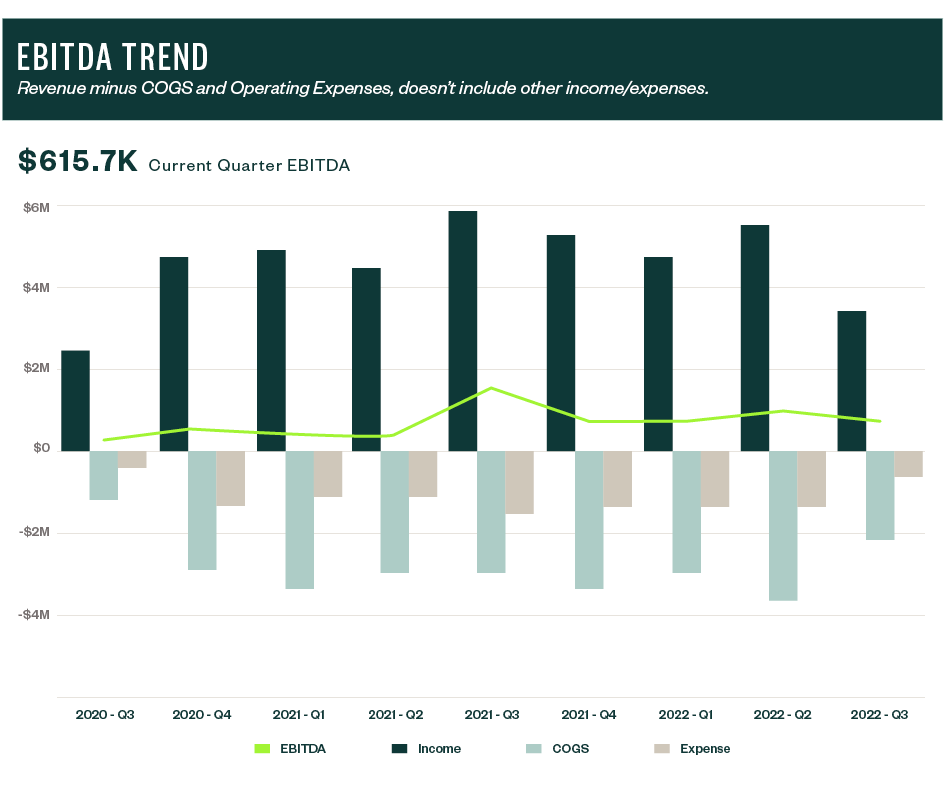
The above examples are from a solution showing key financial metrics and trends. The Domo analytics platform allows businesses to harvest key financial data and ensures all within the business can see the trends.
Phase Two
Based on feedback from executives and key stakeholders, you can continue to develop the data visualizations built in phase one. Implement drill-through capabilities into the existing Domo data visualization cards to bring greater detail into your key metrics. This should increase your ability to make data-based decisions around your key metrics performance.
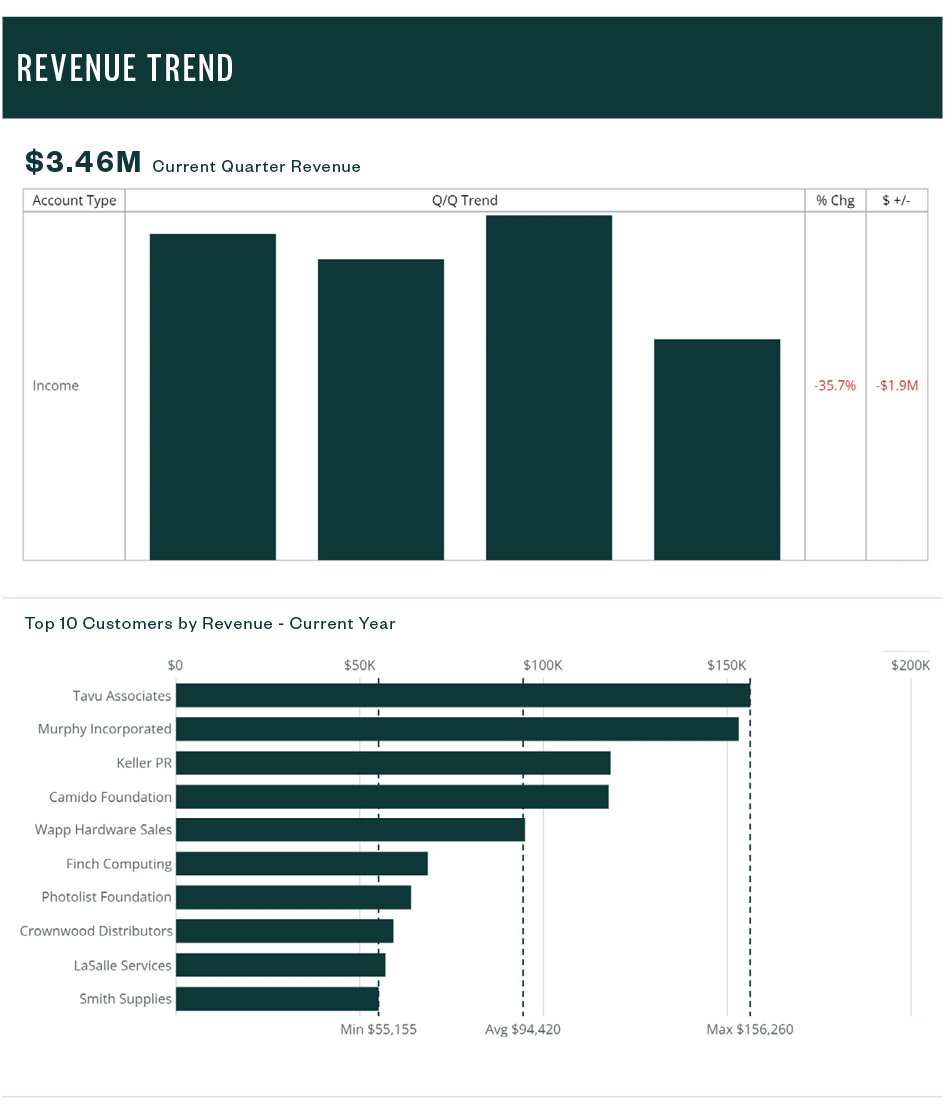
The above figures show an established analytics journey and the unlockable capabilities in Domo. In this model, you can see revenue broken down by quarter and an enabled drill path on the Domo revenue card.
This creates a breakdown data visualization of revenue by customer, which illuminates data that can assist in understanding which customers are spending the most.
Phase Three
Once you’ve created reliable key metric and drill down tracking options, you can add in Domo's data science tiles to access predictive data analytics. This allows you to use historical data to forecast where your business is going and adjust your aims accordingly.
In the above example, you can see Domo’s data science tiles. This example is built to forecast future metrics based on past performance which brings them the ability to adjust as transactions occur.
We’re Here to Help
Incorporating data analytics into finance is an involved process that takes time. If you have further questions about how to implement Domo’s data analytics platform for your business or have questions about data analytics strategies in general, contact your Moss Adams professional.
You can also explore additional information about Domo’s data strategy capabilities and how data analytics can enhance your KPI measurements.