


The central region—the mountain, Midwest, and Great Lakes regions, as well as the state of Texas—has long been a staple for private investment in areas including energy and agriculture, but has started to attract greater attention from the technology sector.
With new remote capabilities forged out of necessity during the pandemic, physical hurdles to dealmaking were reduced. Investment firms still maintain their entrenched hubs of Silicon Valley and New York but can invest with lower barriers to entry for emerging technology ecosystems farther inland.
Trends at a Glance
Private equity (PE) deal activity has shown greater resilience in the central United States than the broader US market after experiencing material growth, while broader US deal value plateaued. Dealmaking has slowed year-to-date (YTD) overall but to a lesser extent in the central region.
Regional venture capital (VC) deal activity has also exhibited periods of greater strength in the central region compared to the broader US, with only a small decline in 2022 at a time when the broader US saw deal value drop by nearly one third.
PE Deal Activity
The central US region encompasses several economic hubs, with cities like Chicago, Denver, and Dallas offering pools of talent in a tight labor market. Demographic trends experienced rapid shifts at the onset of the COVID-19 pandemic, and the technology industry adapted quickly to allow employees to work remotely. This enabled a wave of technology industry workers to migrate out of major cities and settle in places with lower costs of living, among other motivating factors. Private investment activity in the region reflects some of these changes.
In 2020, technology PE activity experienced 29.3% growth in the central US region compared to the broader US market, which saw total PE deal value stall amid pandemic disruptions and a brief economic downturn.
Activity restarted with vigor the following year and held steady in 2022.
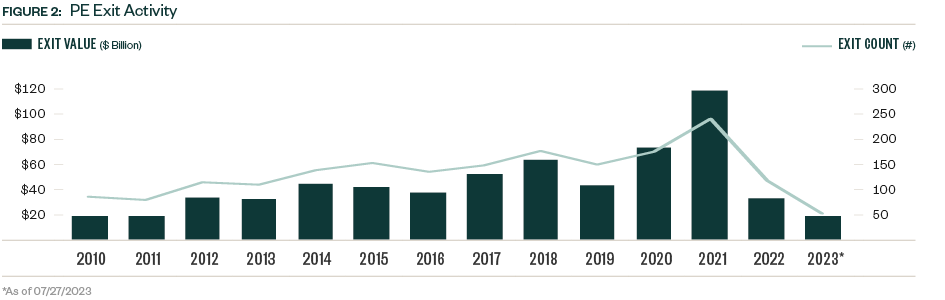
Dealmaking has slowed again in 2023, but YTD deal value was more resilient in the central US compared to the country overall. PE activity in the region is on pace to surpass its pre-COVID-19 annual levels, with $59.6 billion closed YTD compared to $72.9 billion closed in 2019. Total deal value more than doubled between the first and second quarters of 2023 despite a lower deal count driven by a few outlier deal sizes—a positive signal for dealmakers in the region navigating an uncertain macroeconomic landscape.
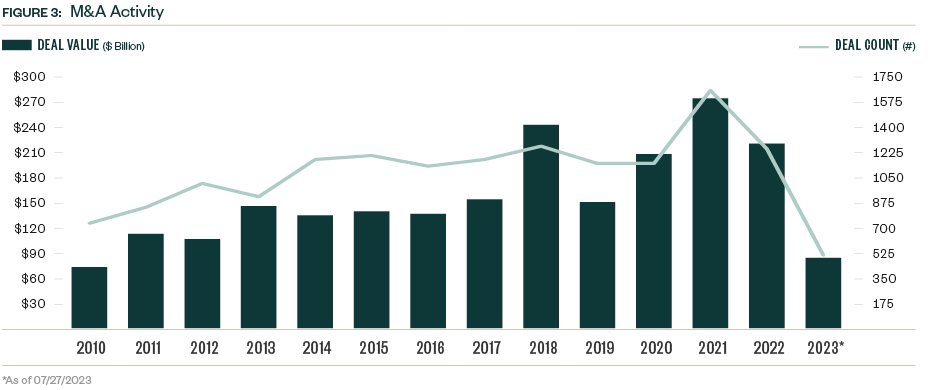
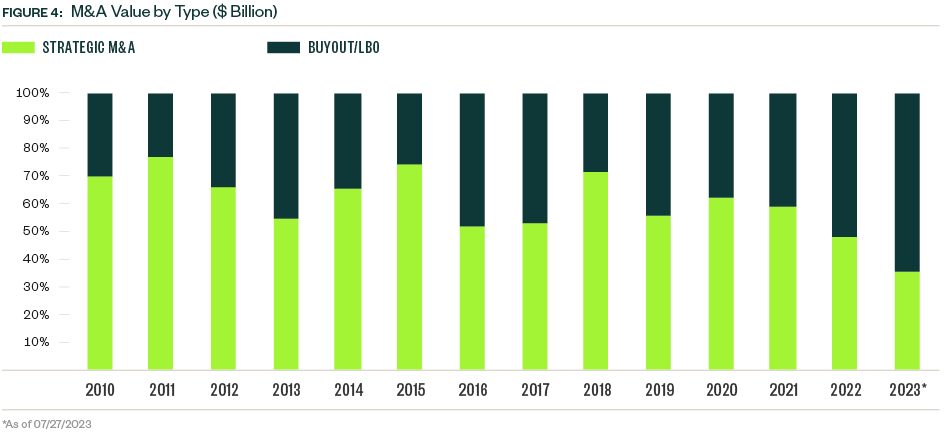
M&A activity slowed moderately in the region, with $84.5 billion YTD compared to $220.5 billion in 2022. Deal value grew 41.6% between the first and second quarters despite continued Federal Reserve tightening, a bright spot in an otherwise difficult high-interest-rate environment. Compared to strategic deals, buyouts and leveraged buyouts (LBOs) typically account for less than half of total M&A value, but YTD account for 64.3%.
Bank failures in the first quarter of 2023 raised concerns for dealmakers, particularly regarding the health of regional banks and access to debt financing in those areas. Silicon Valley Bank (SVB) was purchased by Raleigh-based First Citizens, a move that highlights another growing technology hub in the nation.
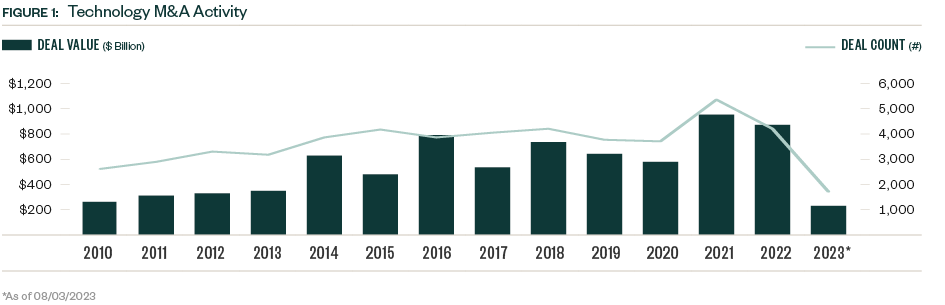
IT software and business-to-business (B2B) products historically drive most technology deals nationwide—including the central region. The B2B sector grew in prominence among PE deals in 2021, but IT software has taken up a greater share each year since then. A relatively small but consistent number of deals in the health care technology space have closed over the past decade in both the PE and M&A asset classes.
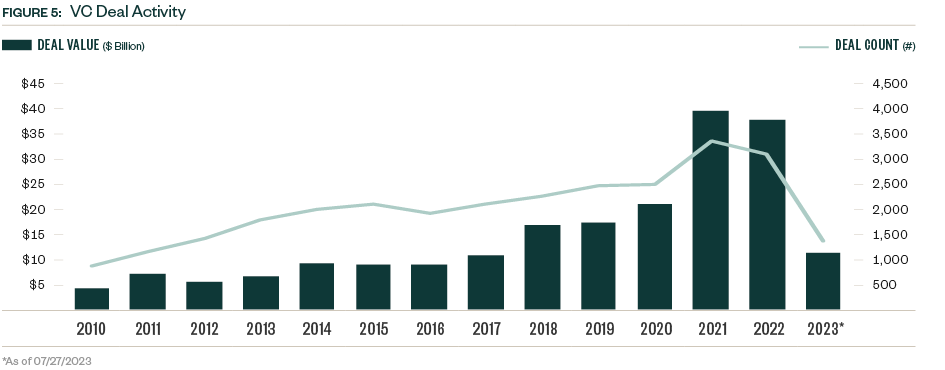
Similar to PE, regional VC activity saw two years of elevated deal activity in 2021 and 2022, with just a slight decline in 2022 despite compounding macroeconomic issues that emerged that year. Activity has slowed further YTD, with a total of $11.3 billion representing less than one-third of 2022's total.
The regional VC market was notably resilient in 2022, with a modest 4.0% year-over-year (YoY) decline in deal value, compared to the broader US, which saw deal value decline by 30.3% in the same period. Both categories show comparable declines since.
First-time VC deals were hit harder by the economic environment in 2022, with a notable 41.9% YoY decline, and dealmaking is still compressed in this category as firms look to hedge risk and focus on their best performers.
Positive economic signals and cooling inflation have strengthened sentiment that federal tightening will decelerate in the short term, which would provide more breathing room for buyouts and larger deal activity. Shifting population trends and economic growth potential are underscoring technology investment in the central United States.
Other Trends
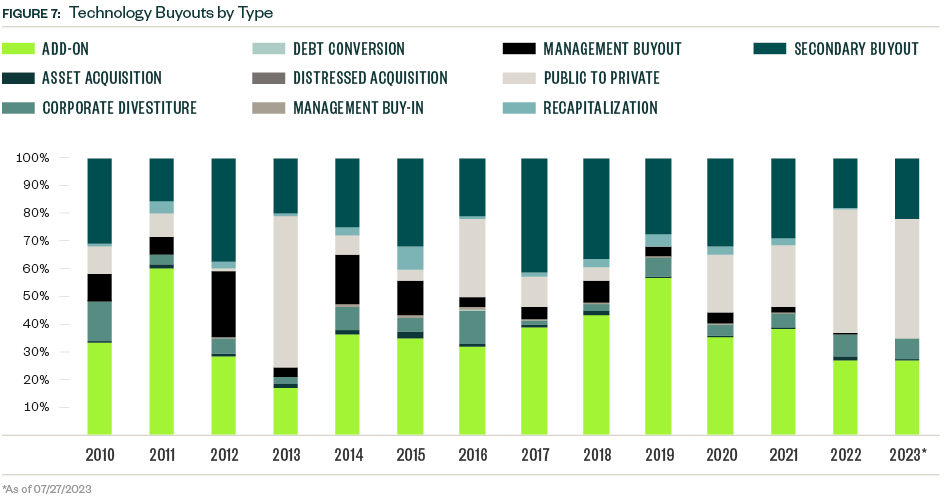
Take-privates and add-ons remain the most popular deal types in the region’s technology industry amid uncertainty in the public markets and hurdles for organic growth due to economic conditions. These two categories accounted for 72.1% of total PE deal value in 2022, up from 61.4% in 2021.
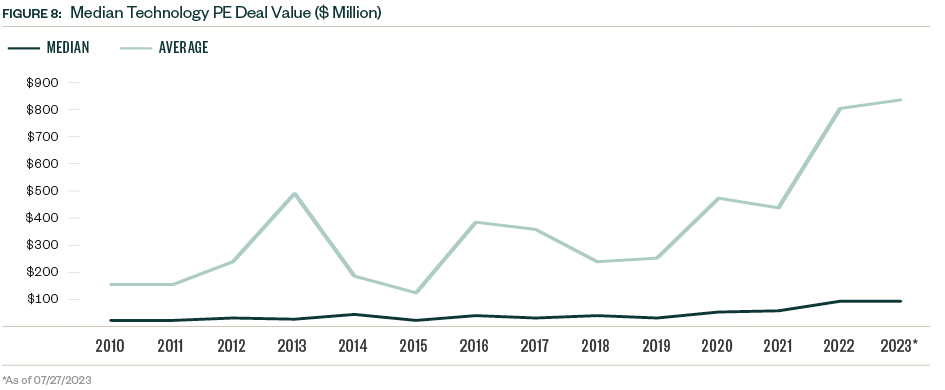
After growing continuously since 2019, the median PE deal size hit a peak of $90 million in 2022 but plateaued YTD.
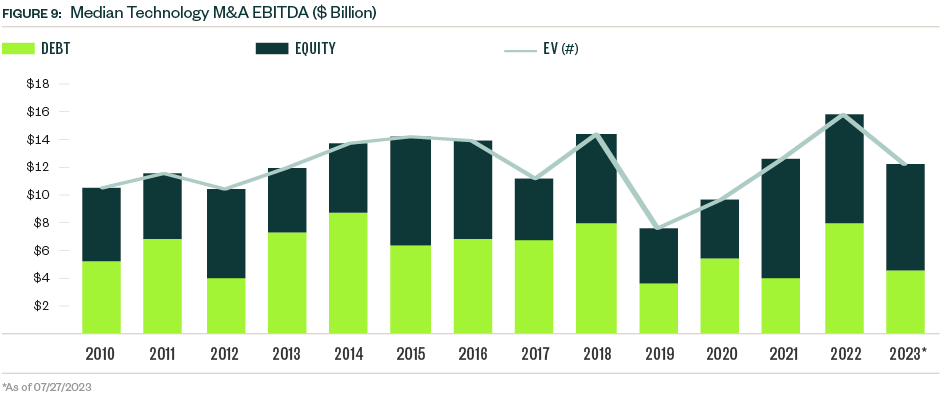
After increasing each year since 2019, the median EV/EBITDA (enterprise value to earnings before interest, taxes, depreciation, and amortization) multiple for M&A in the region hit a peak of 15.8x in 2022. The median debt to EBITDA value has contracted more than the median equity or EBITDA value, underscoring the impact of higher lending costs after several federal tightening moves.
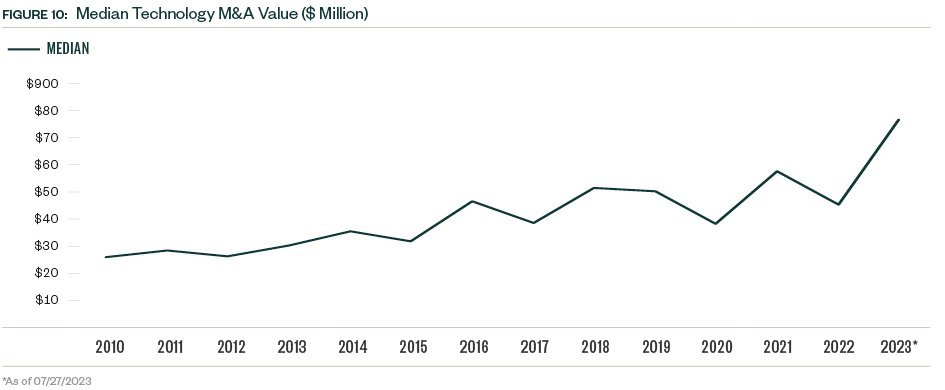
The median M&A size spiked 69.8% to $76.5 million YTD as financing costs rise.
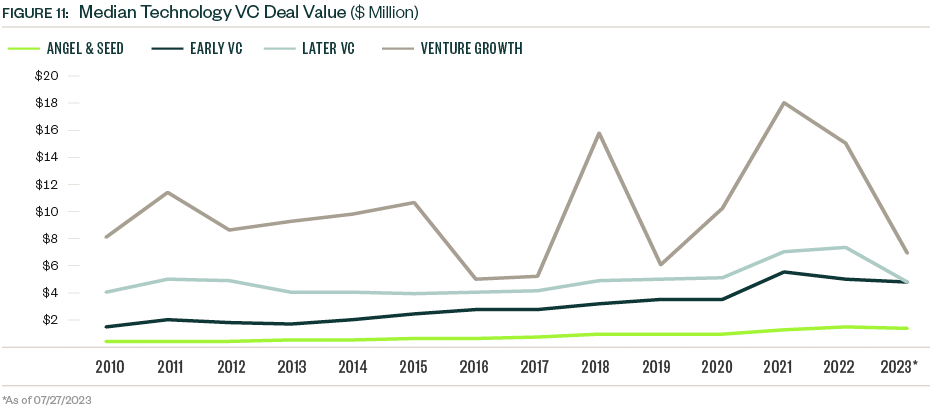
Median deal sizes have declined YTD for all VC stages, with more pronounced drops for the later, more mature stages.
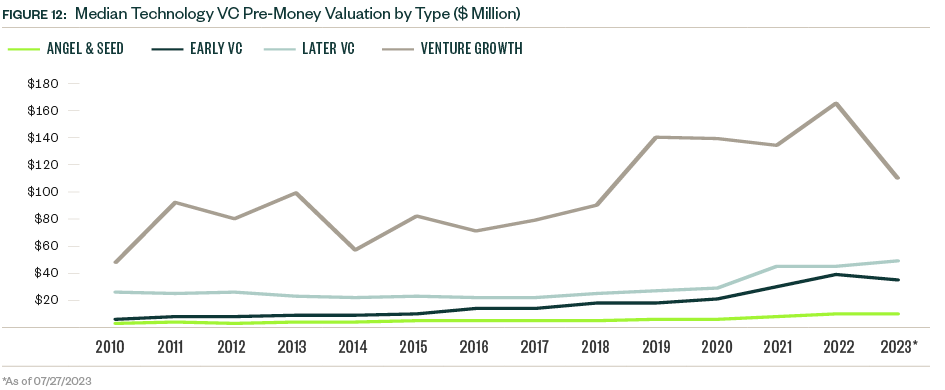
Median pre-money valuations declined for most stages except late-stage VC, which increased by 8.5%.
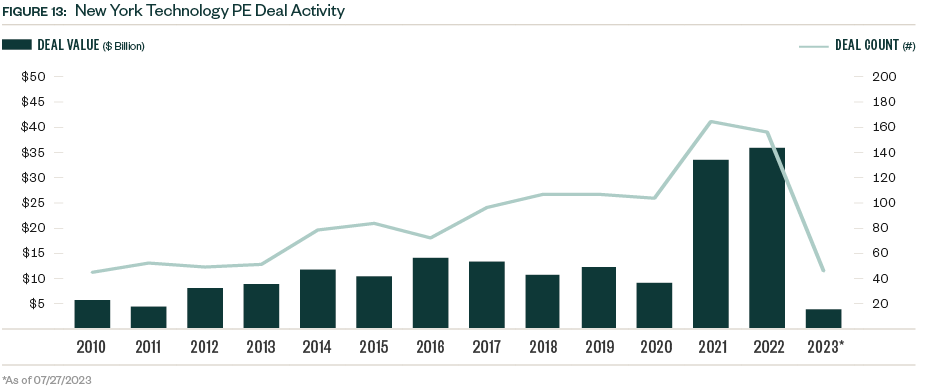
New York is one of the primary investment hubs in the country with nearly as much VC deal value generated in the metropolitan area as in the entire central US region—a far larger geographic area. The central region generates far more PE and M&A deal value by comparison.
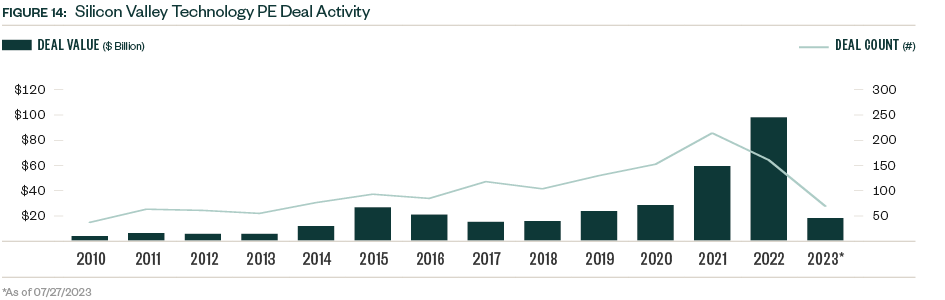
Silicon Valley is undoubtedly the central hub of VC activity in the US, with YTD deal value in the area more than triple that of the central region despite similar deal counts. The central region generated more than double the amount of M&A value and more than triple the amount of PE deal value than Silicon Valley YTD.
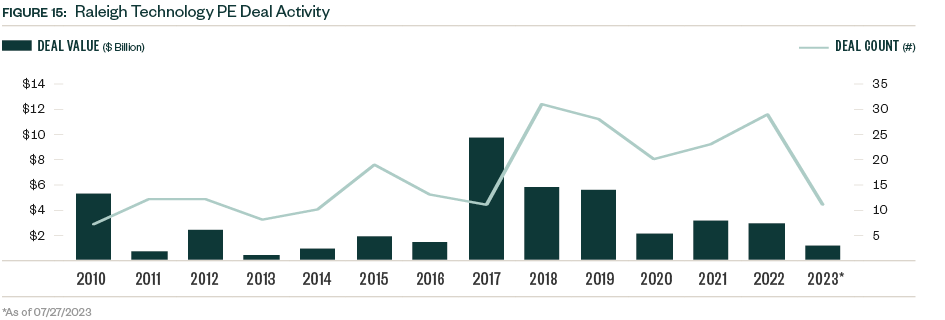
North Carolina’s Research Triangle area—which includes Raleigh, Durham, and Cary—is another emerging technology hub with significant growth in VC activity since 2018. PE activity in the region surged between 2017 and 2019 but has slowed since.
Methodology
The central US region is defined in this report using the combined geographies of the Mountain, Midwest, and Great Lakes regions, in addition to the state of Texas. M&A values were extrapolated. Otherwise, PitchBook’s standard methodologies for report datasets covering M&A, PE, and venture were used. Full details can be found here.
We’re Here to Help
For more information about the central region and technology sector, please contact your Moss Adams professional.