


Data and business analytics can drive value and agility when used strategically. Access to organized, readily available and regularly updated data can help a business respond to insights gathered from the data.
Automating and standardizing data analysis can help your organization better understand trends, free up time, and inform strategy.
What Is Data Automation?
Data analysts can spend a significant amount of time on data collection, data cleaning, and data organization. Data automation can eliminate manual processes—downloading, integrating, and organizing data from various systems—for significant time savings.
To take your data analytic strategy to the next level, your brick-and-mortar store or e-commerce business should take advantage of cloud-based data storage solutions, such as Amazon, Google, or Microsoft. Data from these platforms can be downloaded into a data warehouse that can act as a utility and expand as your data needs grow.
Once all data is collected into a single source—the data warehouse—you can transform it using a reporting engine, such as Tableau, Power BI, Domo, QuickSight, or various other data analytics platforms. These tools can help establish standardization without the use of spreadsheets.
Standardized management of your data allows your organization to see the same sets of data, and all stakeholders can be on the same page. This can be a powerful way of running a retail business and helps you move forward and monitor your strategy.
What Is Analytic Process Automation (APA)?
Analytic process automation refers to tools such as Alteryx, Microsoft Power Automate, and Tableau Prep. It functions by automating the process of compiling and preparing data from multiple source systems and sharing the data via a data analytics platform throughout an organization.
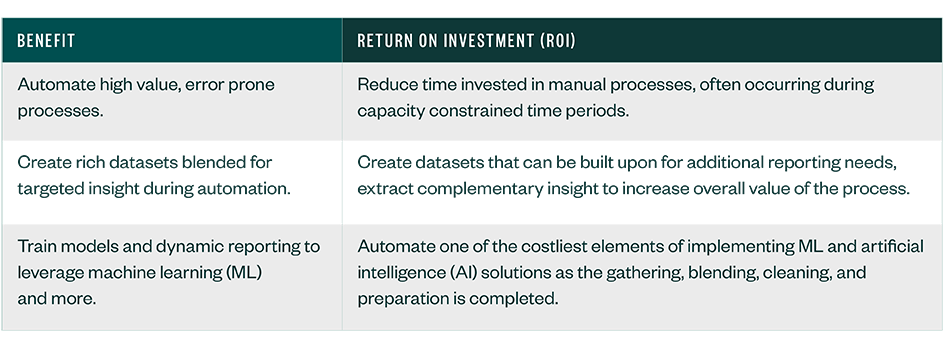
Rather than use spreadsheets to do VLOOKUPS or adjust column dimensions, data can be run through these tools which streamlines the process and creates an output. These tools can help reduce the number of errors with limited human involvement. The more time you can give back to your analysts, the more they can focus on data analytics strategy and strategic initiatives rather than data cleaning.
The output generated from these tools is a rich, blended dataset that enables an organization to build an understanding of how their business operates, whether it’s a brick-and-mortar or e-commerce business. This can become a dynamic process that can be automatically used and leveraged in future models, like ML and AI. Once you streamline and automate data analytics processes, you can then utilize that data to train your models to be smarter over time.
Common Characteristics Data Automation Can Support
Consider analytic process automation for e-commerce growth if:
- You have complicated periodic—annual, monthly, or weekly—processes that require creating or updating a big spreadsheet.
- You need to collect and combine data from multiple systems or transfer data into a database.
- You want to be more data-driven but find the learning curve steep and the foundation needs improvement.
- Your processes are maintained or done by a limited number of individuals and there’s risk that the process would be difficult to reproduce in the event of a staffing change.
- You want to free up time for employees who manage Excel spreadsheets.
- You want to complete time-intensive analysis more frequently and efficiently without adjusting head count.
Visual Data Analytics
The two data analytics visualizations below provide examples to how the analytics can help provide deep insight into your data.
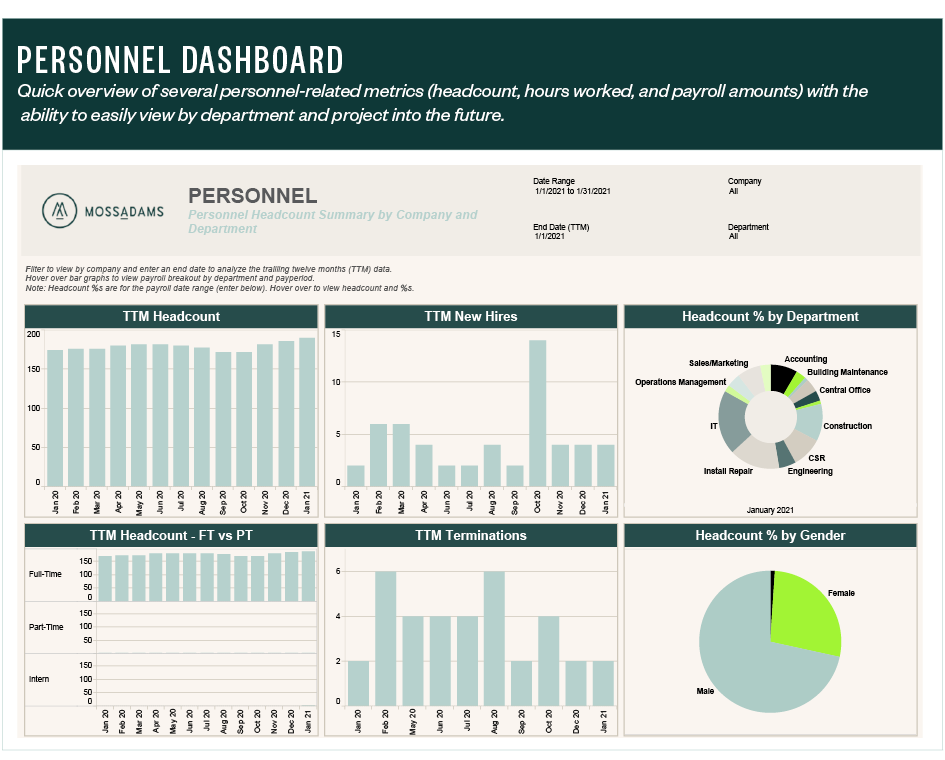
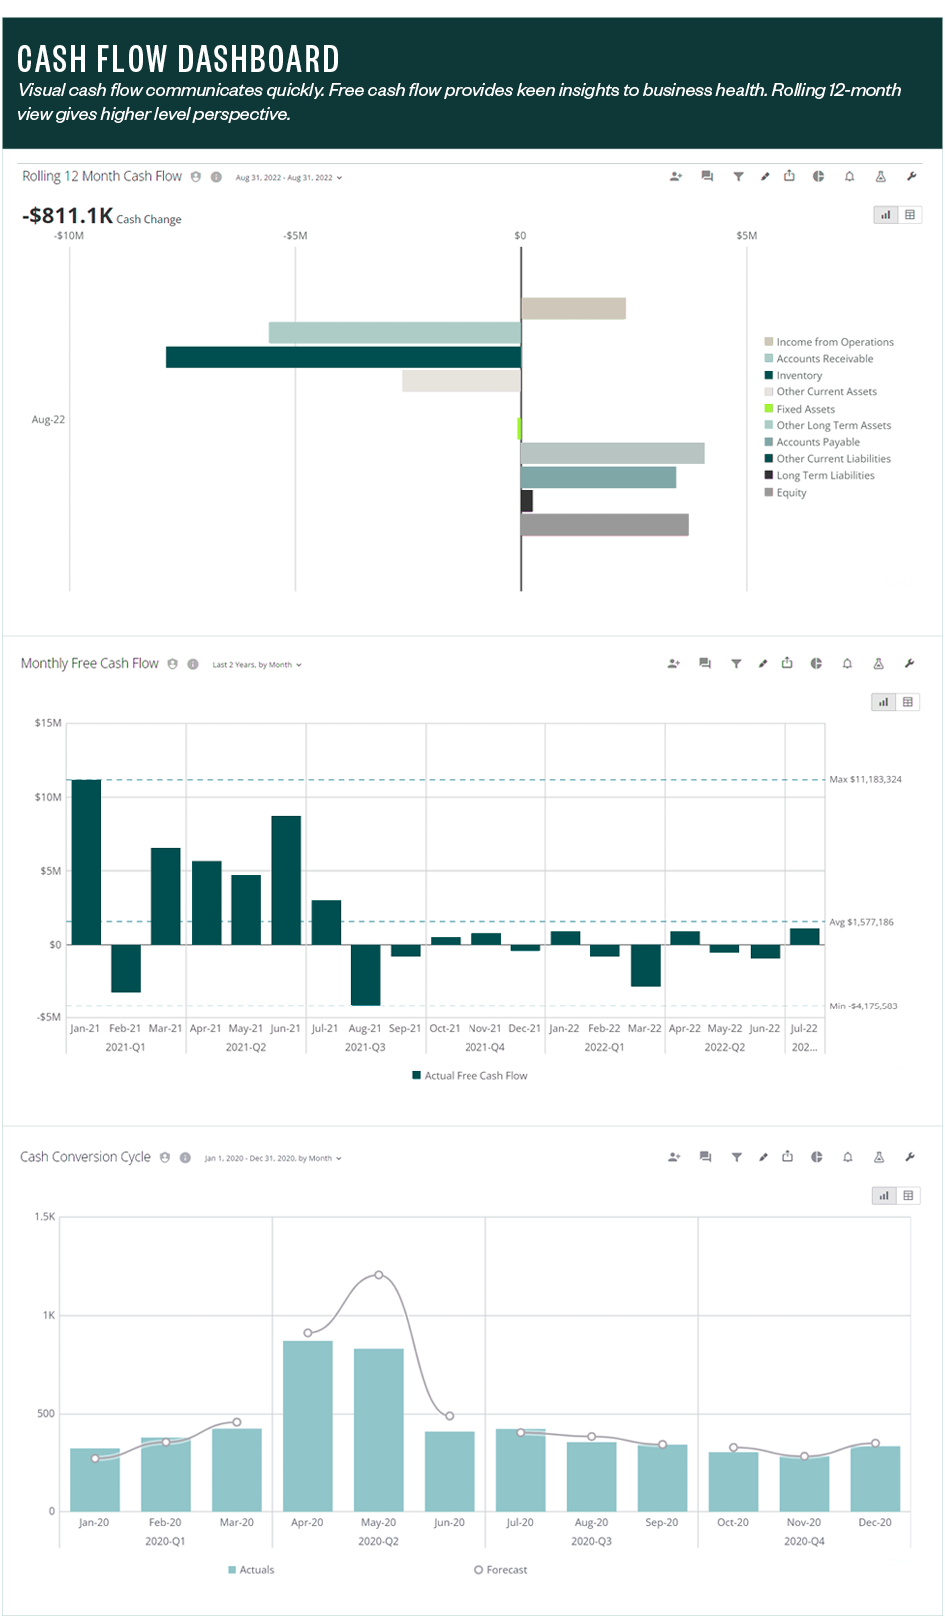
When data is clean, you can really use the power of the toolset. An informative data analytics visual is more than a row- or column-based spreadsheet and can help you more easily notice trends and outliers.
Today’s data analytics platforms aren’t just a static picture that you can't see behind. They allow you to click on the visual and drill down to the record that’s reported. This makes in-depth diagnostic and detailed research possible.
We’re Here to Help
For help assessing your current data structure and implementing more robust data analytics platforms and processes, contact your Moss Adams professional.
You can also visit our Data Analytics Consulting Services page for additional resources.